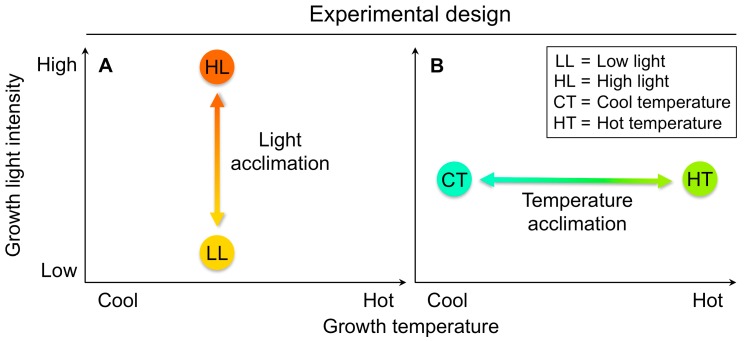
Figure 3.
Schematic depiction of the experimental design used to assess (A) light acclimation and (B) temperature acclimation of phenotypic traits (see e.g., Stewart et al. [71]). LL, HL—growth light intensities of 100 and 1000 µmol photons m−2·s−1, respectively, at a leaf temperature of 20 °C during the light period; CT, HT—leaf temperatures of 14 °C and 36 °C, respectively, under a growth light intensity of 400 µmol photons m−2·s−1.

