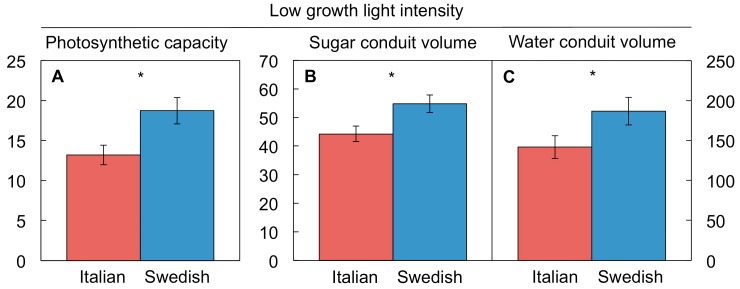
Figure 6.
(A) Photosynthetic capacity (µmol O2 m−2·s−1) and volumes (mm3 m−2) of minor-vein (B) sugar-transporting and (C) water-transporting conduits in leaves of Italian and Swedish ecotypes of A. thaliana grown under low light intensity (100 µmol photons m−2·s−1) at moderate leaf temperature (20 °C). Mean values ± standard deviations (n = 4); significant differences (t-test) indicated by asterisks—* = p < 0.05. Data from Stewart et al. [86].

