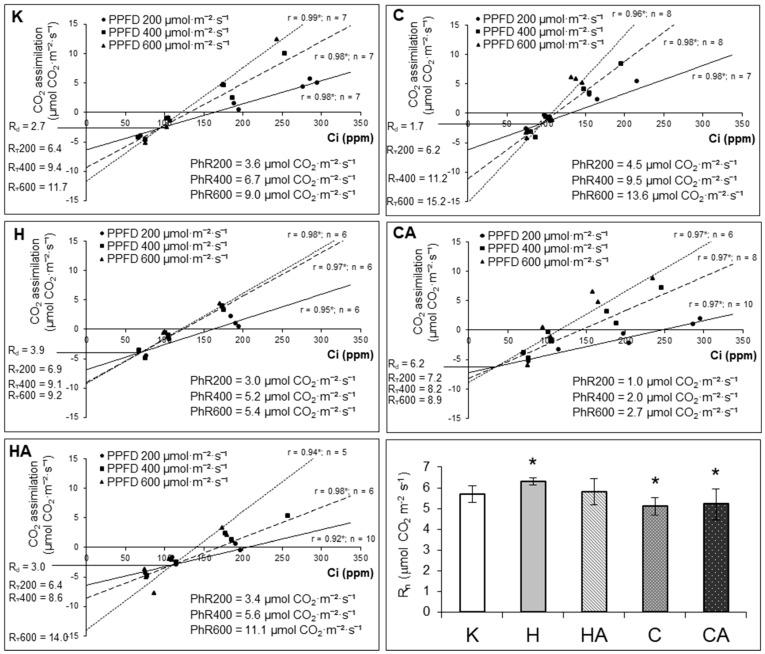
Figure 5.
Changes in cauliflower leaf light (Rd), dark (Rn) respiration as well as total light (RT) respiration and (PhR) photorespiration (all expressed in µmol CO2·m−2·s−1) at 200 (RT200 and PhR200), 400 (RT400 and PhR400) and 600 (RT600 and PhR600) µmol·m−2·s−1 illumination rate in control grown (K), heat-stressed (H), heat-recovered (HA), cold-stressed (C) and cold-recovered (CA) plants. All parameters were measured on 3-month-old plants with fully developed leaves with the application of an infrared gas analyser. Data were recorded after at least 2 h of illumination. During the experiment, each of the analysed leaves were placed into a 6-cm2 chamber of the analyser. Results were recorded after initial leaf acclimation to the desired light and CO2 concentration, relative humidity and temperature. The Rd rate was determined according to the Laisk [55] method. The photorespiration rate for each PPFD value was determined as the difference between RT and Rd values. Error bars denote ± S.D. Asterisks indicate significantly different curves at p = 0.05 (Student’s t-test). Further experimental details in Materials and Methods.

