Figure 2.
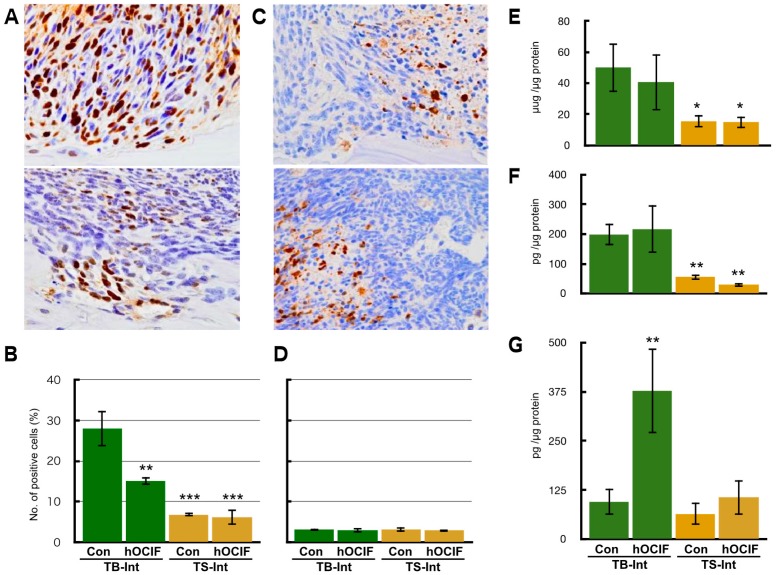
Effects of hOCIF on tumor growth in the tumor microenvironments (2). (A) PCNA staining of the control group at the TB-interface (upper, ×400) and the treatment group (lower, ×400); (B) Quantitative analysis of PCNA positive cells at the TB- and TS-interfaces; (C) Cleaved Caspase 3 staining of the control group at the TB-interface (left, ×400) and TS-interface (right, ×400); (D) Quantitative analysis of cleaved caspase 3 positive cells at the TB- and TS-interfaces; Cytokines levels of TGFβ (E), RANKL (F), and mOPG (G) at the TB- and TS-interfaces. The levels of TGFβ and RANKL level were higher at the TB-interface compared with those at the TS-interface. hOCIF treatment did not suppressed the levels of these cytokines. hOCIF treatment significantly increased mOPG levels at the TB-interface but did not change mOPG levels at the TS-interface (G). *, **, *** p < 0.05, p < 0.01, p < 0.001 vs. Con at the TB-Interface.

