Figure 3.
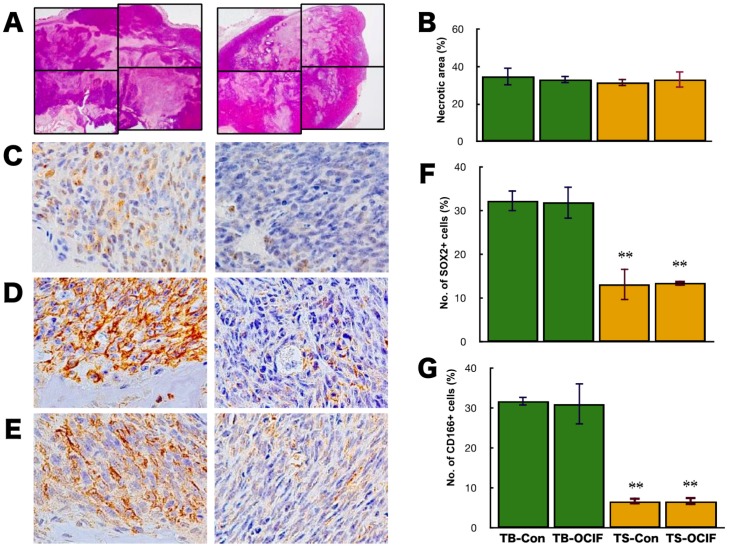
Effects of hOCIF on the induction of necrosis and CSCs in the tumor microenvironment. The necrotic area in the tumors was determined by microscopic analysis and image analyzer in the control and hOCIF groups (magnification ×1) (A). Quantitative analysis of the necrotic area revealed that hOCIF treatment did not affect the necrotic area (B). Among the available CSC markers, SOX2 (C), CD44 (D), and CD166 (E), positive cells were observed at both the TB- and TS-interfaces (magnification ×400). Quantitative analysis revealed that the number of SOX2 positive cells at the TB-interface was higher than those at the TS-interface. hOCIF treatment did not affect the number of SOX2 positive cells in either interface (F). Similar results were obtained for CD44 positive tumor cells (G). ** p < 0.01 vs. TB-Con.

