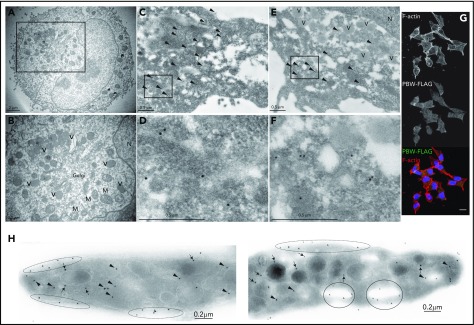
Figure 4.
Subcellular localization of PBW-FTAP and Nbeal2. (A) Ultrastructure of PBW-FTAP in CHRFs by transmission electron microscopy (TEM). (B) High magnification of the area squared in panel A showing intracellular vesicles (V), mitochondria (M), Golgi, and the nucleus (N). (C) Indirect gold-labeling of PBW-FTAP using anti-FLAG. Arrowheads point to clusters of gold across the cytoplasm of CHRFs. (D) High magnification of the boxed area in panel C. (E) PBW-FTAP in CHRFs stained as in panel C showing gold clusters in the cytoplasm but not in the intracellular vesicles. (F) High magnification of the boxed area in panel E. (G) Labeling of F-actin filaments with Phalloidin (top panel), PBW-FTAP (middle panel), and overlay (bottom panel) of the results from top and middle panels, visualized by confocal microscopy; nucleus stained with DAPI. Scale bar (which applies to all subpanels in panel G) represents 10 μm. (H) Gold-labeling of Nbeal2 in human platelets with rabbit antiserum. Gold particles label the platelet cytoplasm (arrowheads), α-granules (arrows), OCS (circles), and periphery (flat ellipses). Images are representative of the results of 2 TEM, 1 (gold-labeling), and 3 (confocal microscopy) independent experiments.

