Figure 1.

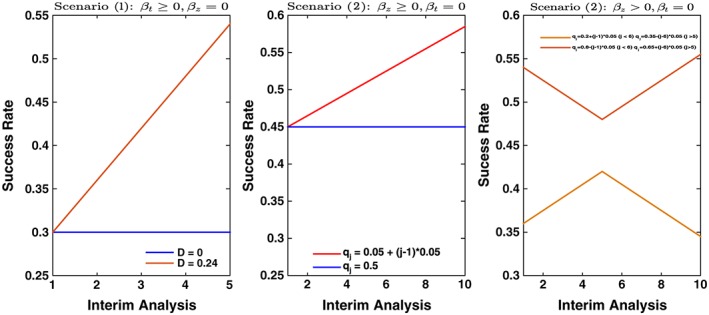
The per block success rate under different time trend assumptions plotted over time. Left plot corresponds to scenario 1 (changes in standard of care), and middle and right plots correspond to different cases of scenario 2 (patient drift)

The per block success rate under different time trend assumptions plotted over time. Left plot corresponds to scenario 1 (changes in standard of care), and middle and right plots correspond to different cases of scenario 2 (patient drift)