Figure 4.

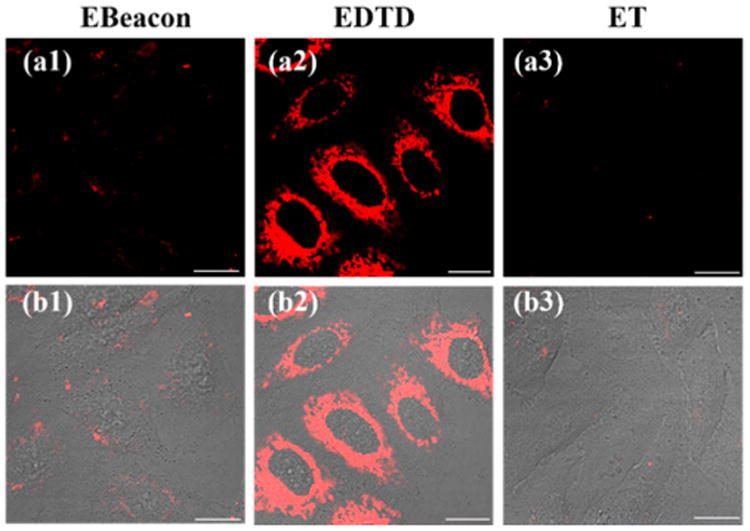
Fluorescence images of TK1 mRNA in HepG2 cells incubated with Ebeacon (1), EDTD (2), and ET (3), respectively. Fluorescence (a) and merged (b) images. Scale bar: 20 μm.

Fluorescence images of TK1 mRNA in HepG2 cells incubated with Ebeacon (1), EDTD (2), and ET (3), respectively. Fluorescence (a) and merged (b) images. Scale bar: 20 μm.