
Figure 5.
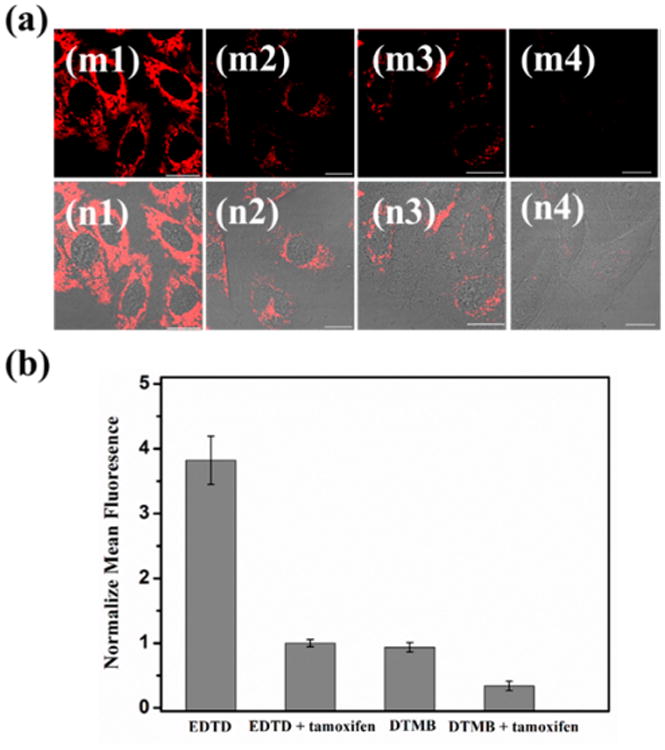
(a) Fluorescence image of TK1 mRNA with a reduced expression level. Left panels (1) are the EDTD-incubated group without treatment with tamoxifen. Middle panels (2) are cells treated with tamoxifen, followed by incubation with EDTD. Middle panels (3) are the DTMB-incubated group without treatment with tamoxifen. Right panels (4) are cells treated with tamoxifen, followed by incubation with DTMB. (m) Fluorescence. (n) Merged with DIC. Scale bars are 20 μm. (b) Histogram of the relative fluorescence intensity of the above four groups.