Fig. 1.
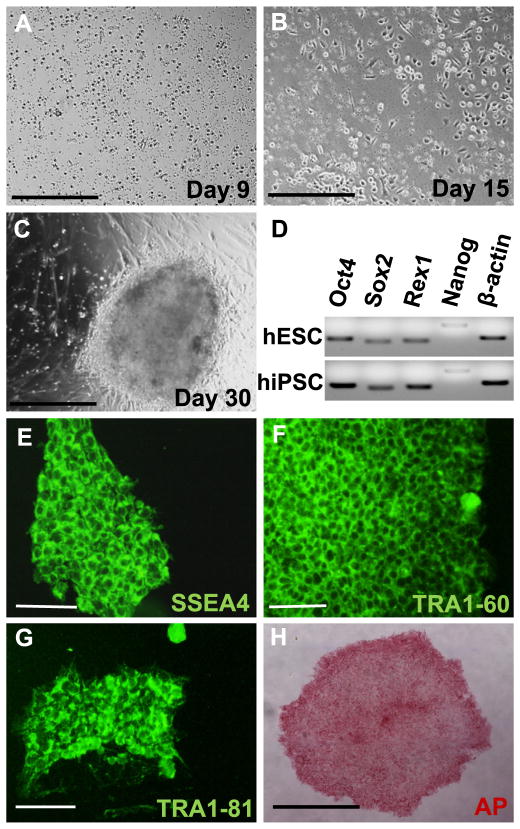
hiPSCs were generated from healthy donor blood. (A) PBMCs during expansion at day 9. (B) PBMCs after transduction with Lentiviral vector expressing Oct4, Klf4, Sox2 and c-Myc at day 15. (C) At around day 30, fully formed iPSC-like colonies appear. (D) Pluripotency specific gene expression for Oct4, Sox2, Rex1 and Nanog was checked by qRT-PCR. (E–H) Pluripotency is confirmed by immunocytochemistry with SSEA4, TRA-1-60, TRA1-81 (green) and alkaline phosphatase staining (red). Scale bar in A, B and H represents 500 μm and in E, F and G represents 100 μm.

