Fig. 2.
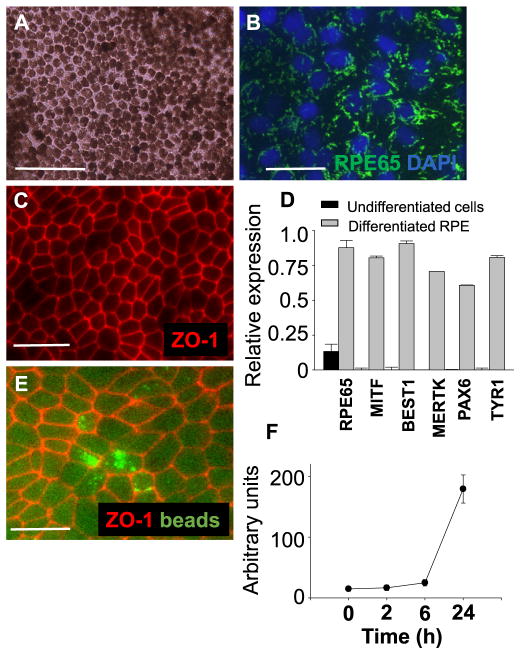
Differentiated RPE cells display RPE-specific features. (A) Morphology of RPE cells differentiated from hiPSC lines is shown by light microscopy. (B, C) RPE65 (green) and ZO-1 (red) immunocytochemistry shows localization in hiPSC-RPE cells. Nuclei were stained with DAPI (blue). (D) qRT-PCR gene expression analysis shows relative gene expression of RPE65, MITF, BEST1, MERTK, PAX6 and TYR1 normalized to GAPDH. (E) Phagocytosis ability of hiPSC-RPE cells is demonstrated by ingestion of beads (green) and immunostaining with ZO-1 (red). (F) Average fluorescence measured over time is shown. Bars indicate mean ± S.D. Scale bars represent 100 μm.

