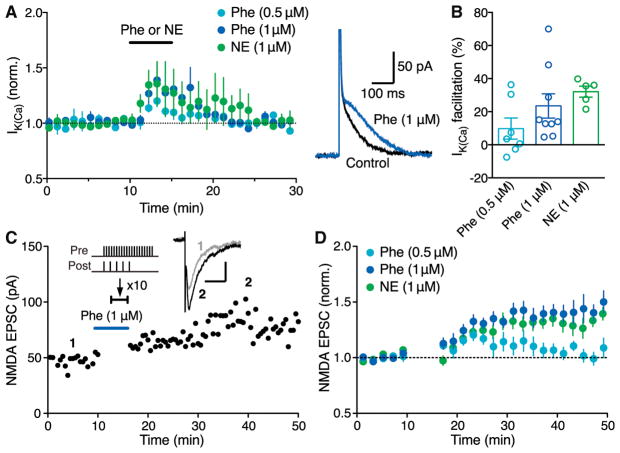
Figure 3. α1AR Agonists Phenylephrine and Norepinephrine Enable LTP without IP3-Induced Ca2+ Signal Facilitation.
(A) Summary time graph (left) and example traces (right; 1 μM Phe) depicting the facilitatory effects of phenylephrine and NE on IK(Ca) (0.5 μM Phe: 7 cells from 3 rats; 1 μM Phe: 9 cells from 6 rats; 1 μM NE: 5 cells from 5 rats).
(B) Summary bar graph showing the magnitude of phenylephrine-induced IK(Ca) facilitation.
(C) Representative experiment to induce LTP-NMDA in the presence of phenylephrine (1 μM) using an induction protocol consisting of synaptic stimulation-burst pairing with no preceding IP3 application. Example EPSC traces at the times indicated are shown in inset (scale bars: 50 ms/20 pA).
(D) Summary time graph of LTP experiments in which LTP was induced using a synaptic stimulation-burst pairing protocol in the presence of phenylephrine or NE (0.5 μM Phe: 7 cells from 7 rats; 1 μM Phe: 10 cells from 8 rats; 1 μM NE: 9 cells from 7 rats).
Data are presented as mean ± SEM.

