
Figure 2.
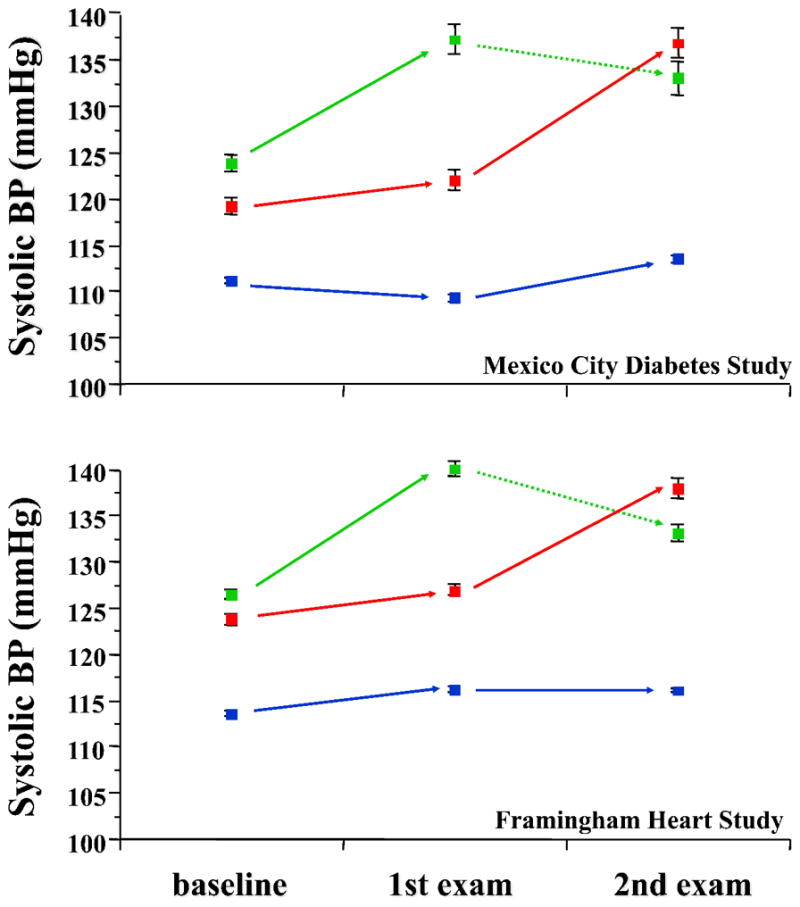
Systolic and diastolic blood pressure values in normotensive subjects who remained normotensive at both follow-up examinations (blue lines), became hypertensive at the first examination (green lines) or at the second examination (red lines). Plots are mean±SD. The dotted green lines indicate that the apparent decline in BP values after diagnosis are likely due to anthypertensive treatment.