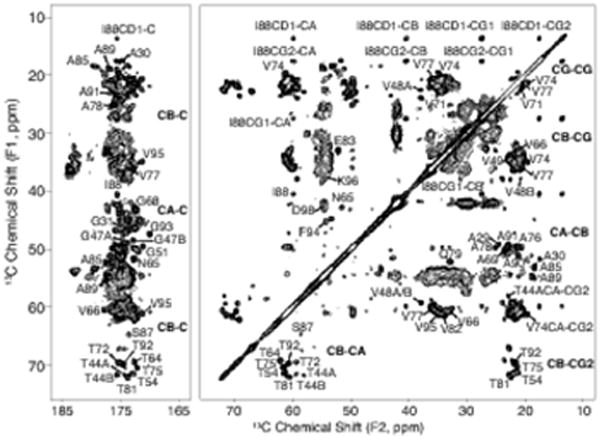
Fig. 1.

C- C correlation spectrum of U-13C, 15N α-synuclein fibril sample showing the carbonyl and aliphatic regions. Data was acquired with 50 ms DARR mixing, 20.48 ms acquisition, and 20.48 ms t1 evolution and processed with 30 Hz net Lorenzian-to-Gaussian line broadening and a second order 50° shifted sine bell. The first contour is cut at 13 times the root-mean-square noise. Residues T44 - V48 exist in two states, labeled A and B
