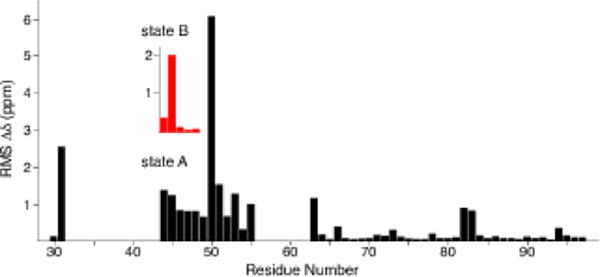
Fig. 3.

Plot of weighted average chemical shift perturbations for all assignments common between the sample studied here and Comellas et al. 2011a (BMRB 16939) for which we solved the structure (PDB code 2N0A, BMRB 25518, (Tuttle et al. 2016a)). The inset with red bars shows the chemical shift perturbations for state B of residues T44 - V48. RMS Δδ was calculated as (Σ_(ΔδCi)2 + (0.4 * ΔδN,)2 }1/2, where i refers to α, β, γ, δ, and ε
