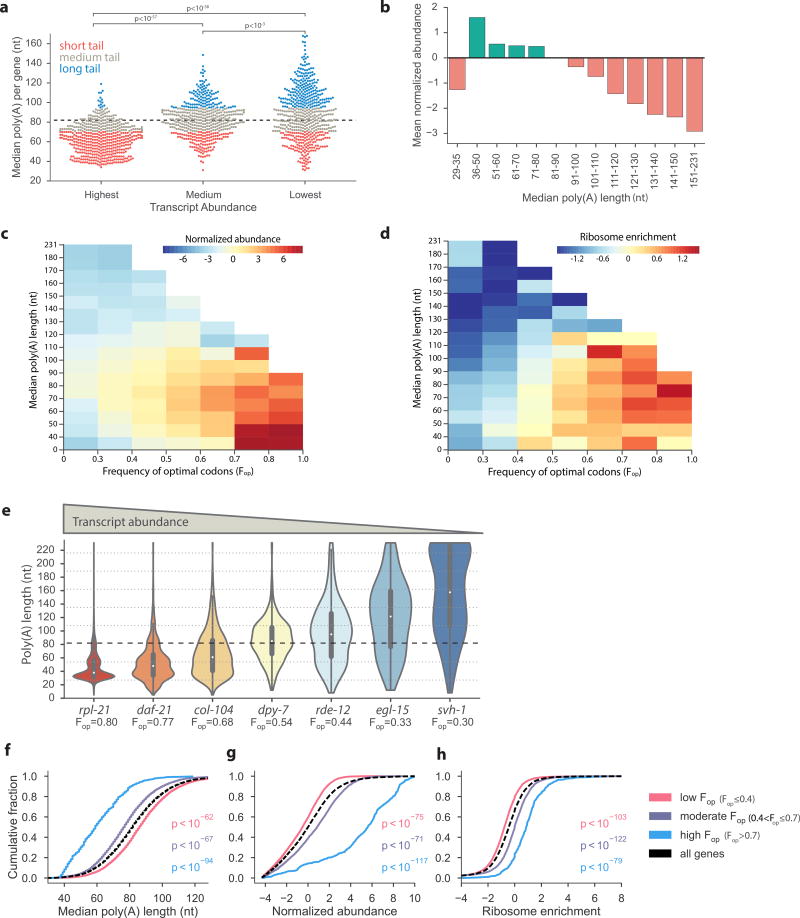
Figure 2.
Highly expressed mRNAs have short poly(A) tails. (a) Tail-length distribution is different in pools of genes with distinct expression levels. The transcript abundance categories represent the highest expressed genes (n = 500), those closest to the median expression (n = 500), and lowest expressed (n = 500). All three distributions were significantly different (Mann-Whitney U test). (b) Global relationship between poly(A) length and abundance was measured by plotting the mean normalized abundance of bins of genes (n = 13,601 protein coding genes) divided by median tail lengths. (c and d) Heat maps demonstrating the interplay of the frequency of optimal codons (Fop) and tail size with transcript abundance (n = 13,421 protein coding genes) (c) and ribosome enrichment25 (n = 13,370 protein coding genes) (d). (e) Violin distribution plots with inlaid box-plots (white dot represents the median) of all tail-length measurements in genes with different frequencies of optimal codons (Fop) and abundance levels. (f to h) C. elegans genes were classified according to codon optimization, demonstrating a significant relationship between translational efficiency and the cumulative distribution of poly(A) length (f), transcript abundance (g) and ribosome enrichment25 (h). Normalized abundance was calculated as the log2 of the fold-change of the number of tags in a transcript over the median transcript level. P-values were calculated using the Mann-Whitney U test between each codon optimization category and all genes sampled. Poly(A) tail measurements, abundance, Fop, and ribosome enrichment for C. elegans transcripts are available in Supplementary Data Sets 1 and 2.

