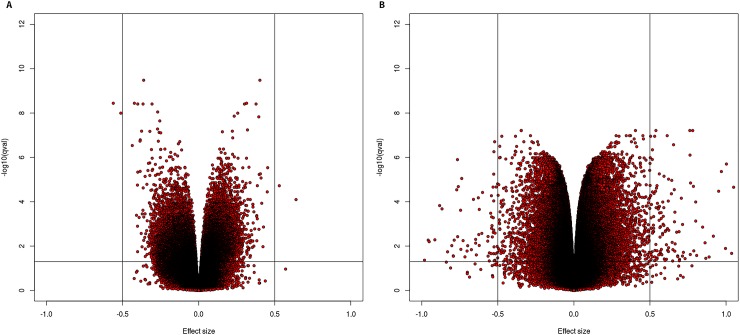
Fig 3. Volcano plots.
(A) Volcano plot DMP association analysis (X and Y chromosomes were excluded from analysis), corrected for gender but not for blood cell distribution. X-axis represents (effect size) adjusted mean delta difference (δ based on adjusted coefficients), Y-axis represents–log10(q-value). Horizontal line indicates significance level (P < 5 10−7), vertical lines indicate δabs > 0,5. (B) Volcano plot DMP association analysis (X and Y chromosomes were excluded from analysis), corrected for gender and blood cell distribution. X-axis represents (effect size) adjusted mean delta difference (δ based on adjusted coefficients), Y-axis represents–log10(q-value). Horizontal line indicates significance level (P < 5 10−7), vertical lines indicate δabs > 0,1.

