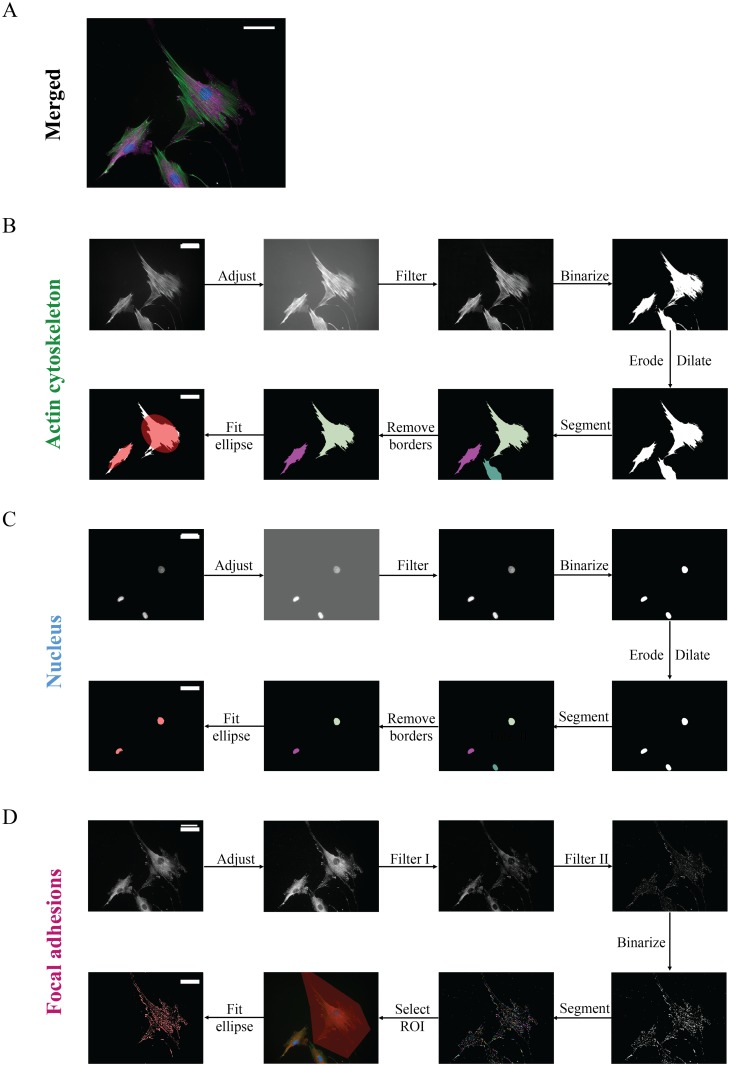
Fig 2. Overview of the steps of the automated image analysis pipeline.
Representative immunofluorescent image of Human Vena Saphena Cells (HVSCs), (A) stained for the actin cytoskeleton (green), nucleus (blue), and focal adhesions (magenta). To automatically detect and analyze cells (B), nuclei (C) and focal adhesions (D), corresponding grey-scale images were processed using the automated image analysis pipeline. Scale bars: 50 μm.

