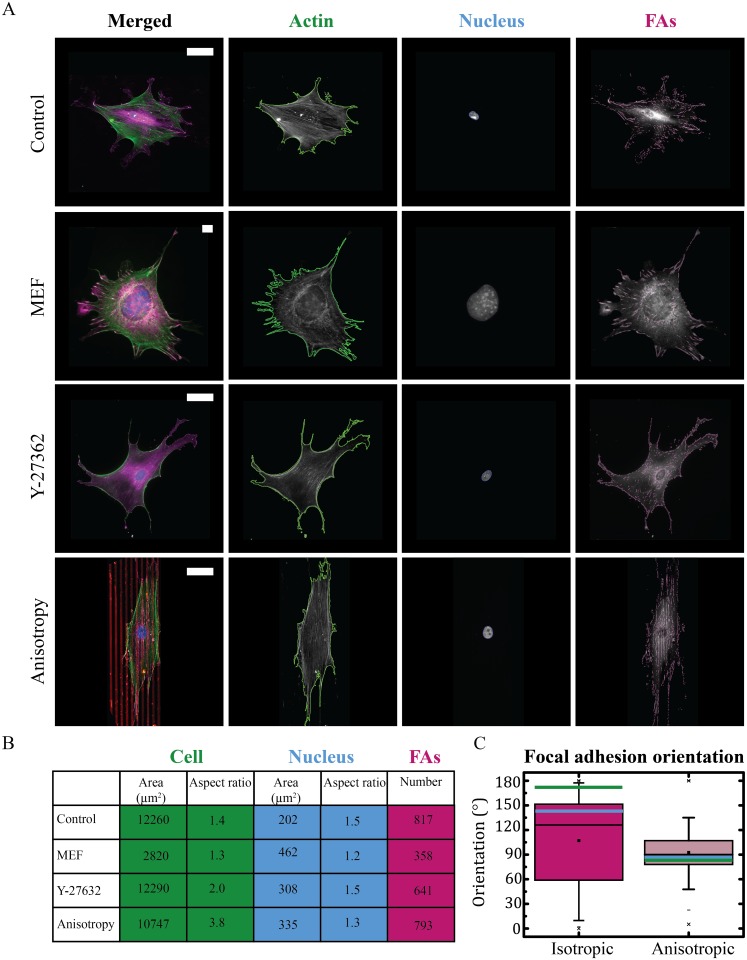
Fig 5. Quantitative analysis of the morphological features of a single cell, nucleus and individual focal adhesions (FAs) obtained under different experimental conditions, e.g. cell type, pharmacological, and substrate manipulation.
A: Representative immunofluorescence images of the actin cytoskeleton (green), nucleus (blue), and FAs (magenta) for a HVSC (control) and a MEF (cell type) on a substrate homogeneously coated with fibronectin, HVSC in the presence of 10 μM of Y-27632 (drugs), and HVSC on 5x5 μm lines of fibronectin (red, anisotropy). The detected outlines are shown in green, blue, and magenta respectively. Scale bar: 50 μm. B: Analyzed morphological features of a single cell, and corresponding nucleus and FAs for the control, cell type (MEF), drug (Y-27632) and environment (anisotropy) situation. C: Boxplot of the orientation of the FAs comparing cells cultured on isotropic and anisotropic substrates. The box and whisker plot indicate the median (black line in the box), 25th percentile (bottom line of the box), 75th percentile (top line of the box), and 5th and 95th percentiles (whiskers). Next to this, the orientation of the cell and nucleus are represented by the green and blue lines, respectively. 90° represents the direction of the lines.

