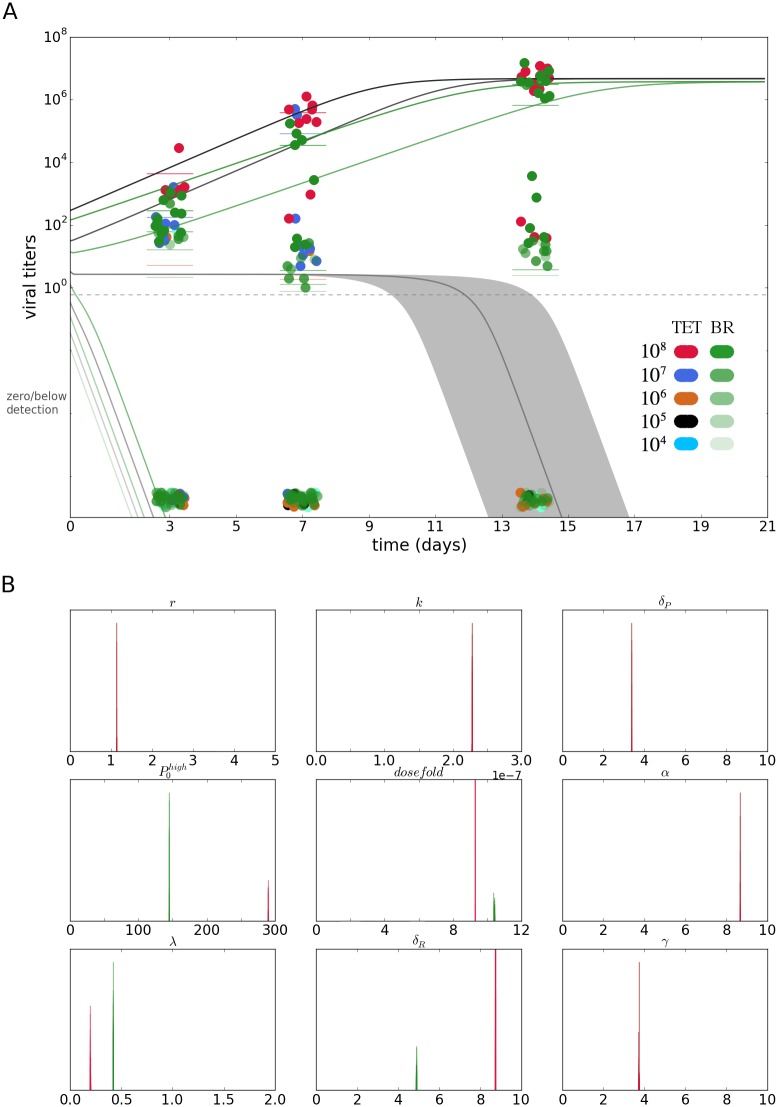
Fig 5. Dynamic model estimate and posterior parameter distributions.
(A) Fit of dynamic host-pathogen model. Grayscale lines represent infection profiles from the wMelTET group; green lines are the profiles for wMelBR group. Green data points are the experimental data for the wMelBR data, and the rest of the colors for the TET group. The dashed line indicates a visual separation of the detection limit, such that anything below it is effectively zero or undetectable. (B) Posterior distribution of estimated parameters. Where parameters are different between groups green color represents the posteriors for the wMel-associated parameters.

