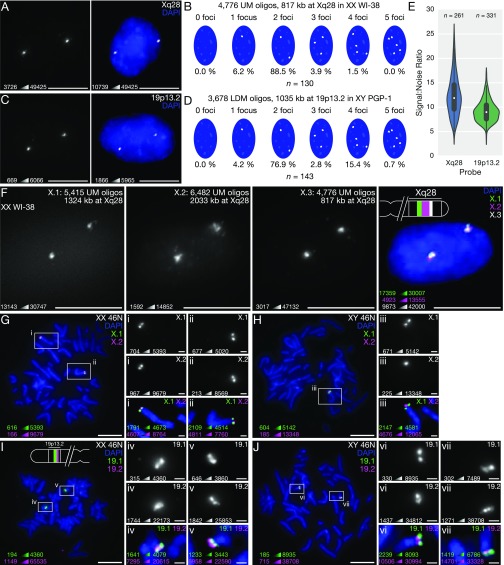
Fig. 3.
OligoMiner enables highly efficient FISH. (A and B) Representative single-channel minimum-maximum (min-max) contrasted image (Left) and two-color image with manual contrast adjustment (Right) (A) and signal number quantification (B) of 3D FISH experiment performed with a probe set consisting of 4,776 UM oligos targeting 817 kb at Xq28 in human XX 2N WI-38 fibroblasts. (C and D) Representative single-channel min-max contrasted image (C, Left) and two-color contrast-adjusted (C, Right) and signal number quantification (D) of 3D FISH experiment performed with a probe set consisting of 3,678 LDM oligos targeting 1,035 kb at 19p13.2 in human XY 2N PGP-1 fibroblasts. (E) Quantification of background-subtracted SNR for the Xq28 and 19p13.2 probes. (F) Three-color 3D FISH experiment performed using ATTO 488-labeled “X.1” (green), ATTO 565-labeled “X.2” (magenta), and Alexa Fluor 647-labeled “X.3” UM probe sets targeting adjacent regions on Xq28 in WI-38 fibroblasts. (G and H) Two-color metaphase FISH experiment performed using ATTO 488-labeled “X.1” (green) and Alexa Fluor 647-labeled “X.2” (magenta) UM probe sets targeting adjacent regions on Xq28 on XX 46N (G) and XY 46N (H) chromosome spreads. (I and J) Two-color metaphase FISH experiment performed using Alexa Fluor 647-labeled “19.1” (green) and Cy3B-labeled “19.2” (magenta) LDM probe sets targeting adjacent regions on 19p13.2 on XX 46N (I) and XY 46N (J) chromosome spreads. All images in are maximum-intensity projections in Z. DNA is stained with DAPI (blue) in multichannel images. In G–J, the multicolor images of the full spread and single-channel images (Inset) are min-max contrasted and the multichannel images (Inset) have manual contrast adjustments. (Scale bars: 10 µm; G–J, Inset, 1 µm.) For each image, the minimum and maximum pixel intensity value used to set the display scale is indicated in the lower left.

