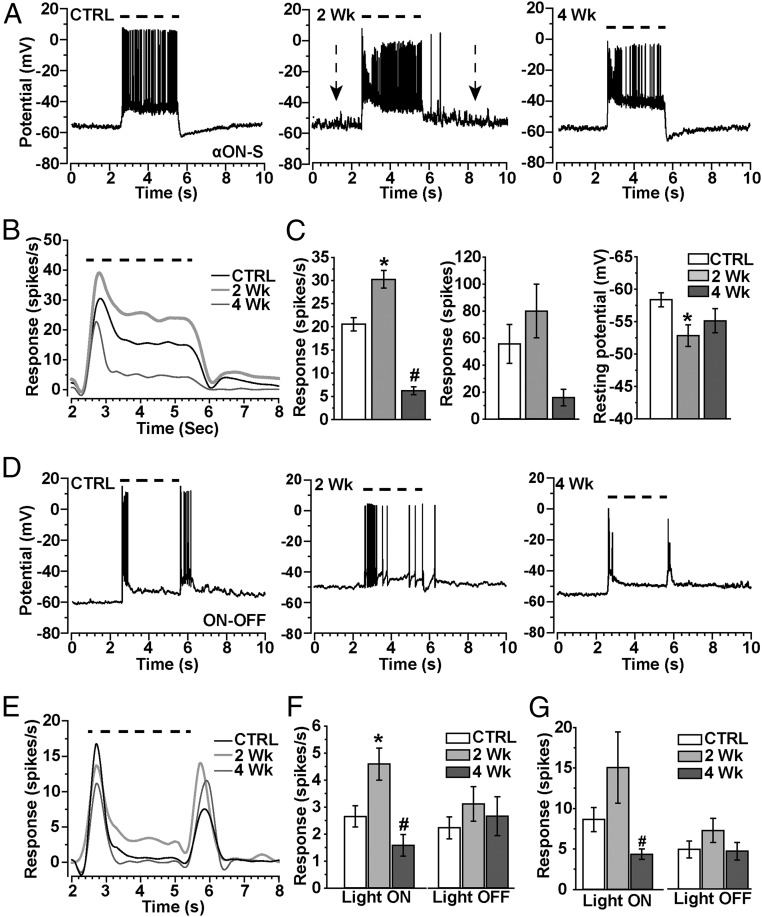
Fig. 3.
Transient increase in light response accompanies dendritic pruning. (A) Whole-cell current-clamped recordings (0 pA) of voltage response before, during, and after a 3-s light exposure (dashed line) for αON-S RGCs from CTRL, 2-wk, and 4-wk retinas. Resting membrane potential appears to increase for 2-wk cells (arrows). (B) Mean voltage firing rate (spikes/s) to light stimulus (dashed line) averaged for CTRL (18), 2-wk (15), and 4-wk (13) αON-S RGCs. (C, Left) Mean response rate (spikes/s) during the light stimulus increases for 2-wk RGCs (*P = 0.04) but decreases for 4-wk cells (#P < 0.001) compared with CTRL. (C, Center) Integrated response (spikes) for αON-S RGCs during light stimulus shows a modest increase for 2-wk cells and a decrease for 4-wk cells, and mean resting potential becomes more depolarized for 2-wk cells (Right; *P = 0.007). (D) Current-clamp voltage response to light (dashed line) for CTRL, 2-wk, and 4-wk ON-OFF RGCs shows transient response to light onset and offset. (E) Response (spikes/s) to light (dashed line) averaged for CTRL (24 cells), 2-wk (14 cells), and 4-wk (17 cells) ON-OFF RGCs shows increased light-induced activity for 2-wk cells. (F, Left) Mean response (spikes/s) of ON-OFF RGCs during light stimulus (light ON) and for a fixed interval (5.5–8.5 s) following light offset (light OFF). Response to light significantly increased for 2-wk cells (*P < 0.001), but decreased for 4-wk cells (#P = 0.001) compared with CTRL RGCs of the same type. (G) Integrated response (spikes) for ON-OFF RGCs during (light ON) and following (light OFF) the stimulus tended to increase for 2-wk cells while significantly decreasing for 4-wk cells (#P = 0.03). The mean integrated response following light offset did not change for either the 2-wk or 4-wk groups compared with CTRL cells (P = 0.44). Data: mean ± SEM.

