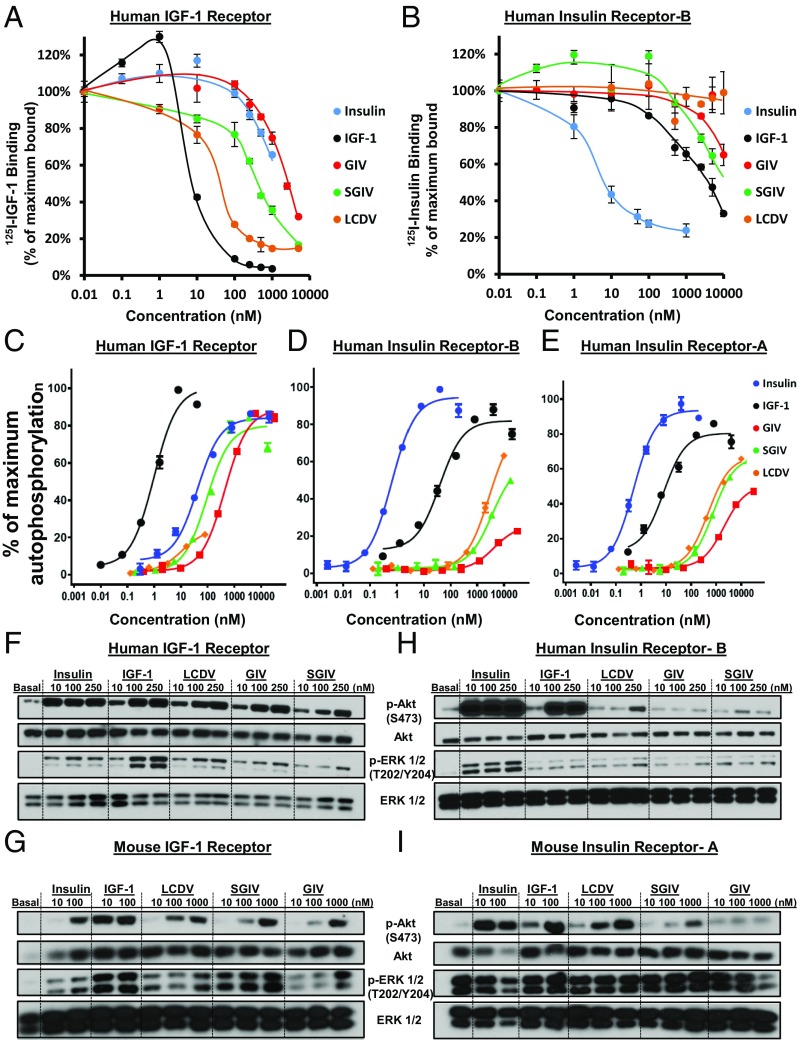
Fig. 2.
VILPs bind to hIR-B and hIGF1R and stimulate downstream insulin/IGF1-signaling pathways. (A and B) Binding competition dose–response curves showing the competing effect of VILPs for the hIGF1R (A) and hIR-B (B). The data are plotted as the percentage of the maximal binding of 125I-IGF1 alone or 125I-Insulin alone and are expressed as mean ± SEM (n = 3). (C–E) Stimulation of IR and IGF1R autophosphorylation using HEK293 cells overexpressing hIGF1R (C), hIR-B (D), or hIR-A (E) and a phosphotyrosine-specific ELISA. (F–I) Western blot analyses of the phosphorylation of Akt and ERK1/2 in lysates of murine DKO brown preadipocytes overexpressing hIGF1R cells (F), mIGF1R (G), hIR-B (H), and mIR-A (I) stimulated with the indicated concentrations of insulin, IGF1, or VILPs for 15 min.

