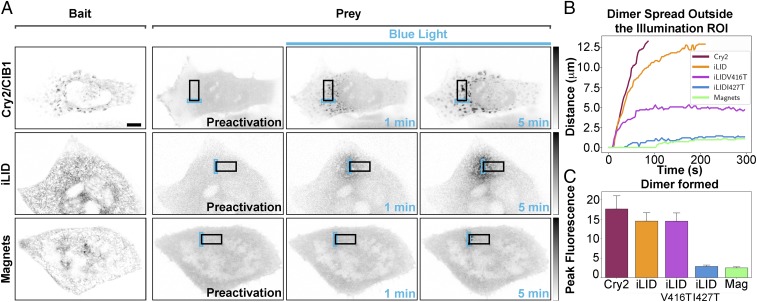
Fig. 2.
Quantification of the spatial confinement of dimer achieved by the three dimerization systems used. (A) HeLa cells expressing a soluble prey and an ER-tethered bait were photoexcited within a 3-µm ×10-µm ROI with 200-ms blue-light pulses at 0.5 Hz for 5 min. The area of prey–bait dimer localization for each dimerization system at 1 and 5 min after stimulation is shown. Fluorescence intensity in each time lapse is minimum–maximum-normalized (grays inverted lookup table), background-subtracted, and filtered with Gaussian blur. (Scale bar: 10 μm.) (B) Plots indicating the spatial spread of dimers away from the illuminated ROI for each system. The lines denote the maximum distance at which the normalized intensity has doubled over that of the intracellular basal intensity (n = 12 cells for Cry2/CIB1, 13 for iLID, 10 for iLID V416T, 6 for iLID I427T, and 17 for Magnets; n = 3). (C) Histograms showing the peak normalized fluorescence intensity reached by each system in the illuminated ROI after 5 min of light excitation [17.6 ± 3.4 for Cry2/CIB1, n = 12; 14.5 ± 2.2 for iLID, n = 13; 14.5 ± 2.1 for iLID V416T, n = 10; 2.9 ± 0.3 for iLID I427T, n = 6; 2.5± 0.3, n = 17 cells for Magnets (Mag); n = 3].

