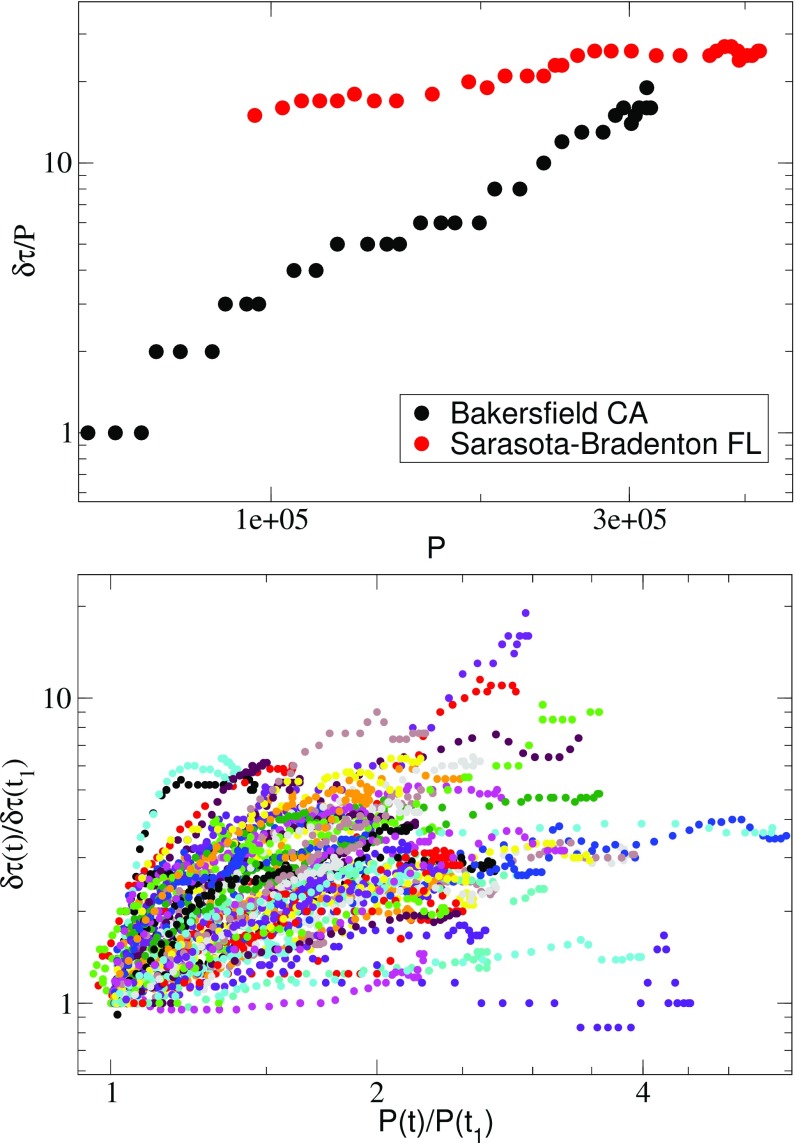
Fig. 4.
(Top) Log-log plot of the annual delay per capita vs. for two different cities: Bakersfield, CA and Sarasota, FL. For the same range of values, the delay is different, and the slopes are different as well. (Bottom) Plot of the rescaled delay vs. . The curves correspond to different cities and the fact that they do not collapse indicates the absence of a unique scaling determined by a single exponent.

