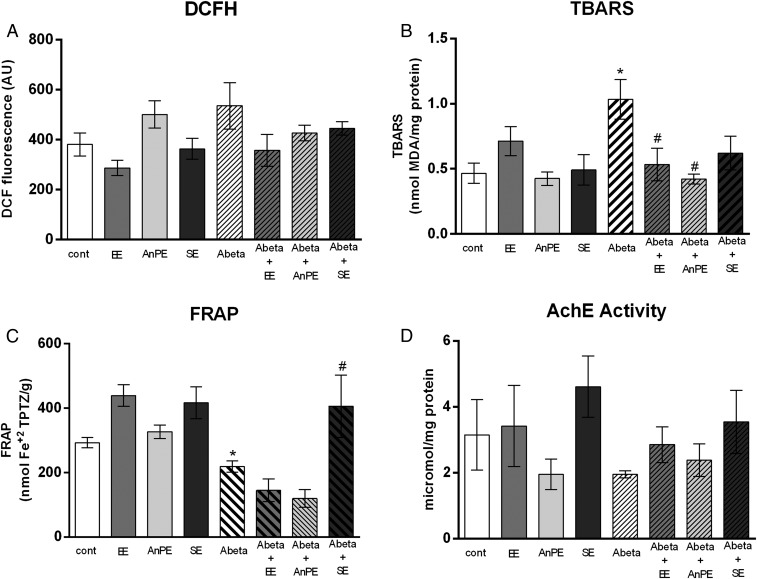
Fig. 3.
Effects of Aβ, EE, AnPE, and SE on the hippocampal oxidative status and AChE activity. (A) ROS determined by DCFH. (B) Lipid peroxidation determined by TBARS test. (C) Total antioxidant capacity determined by FRAP. (D) AChE activity. Data are presented as mean and SE (*P < 0.05, control vs. Aβ; #P < 0.05, Aβ vs. Aβ + specific intervention; Kruskal–Wallis test followed by t tests; n = 5–8 per group). cont, control.

