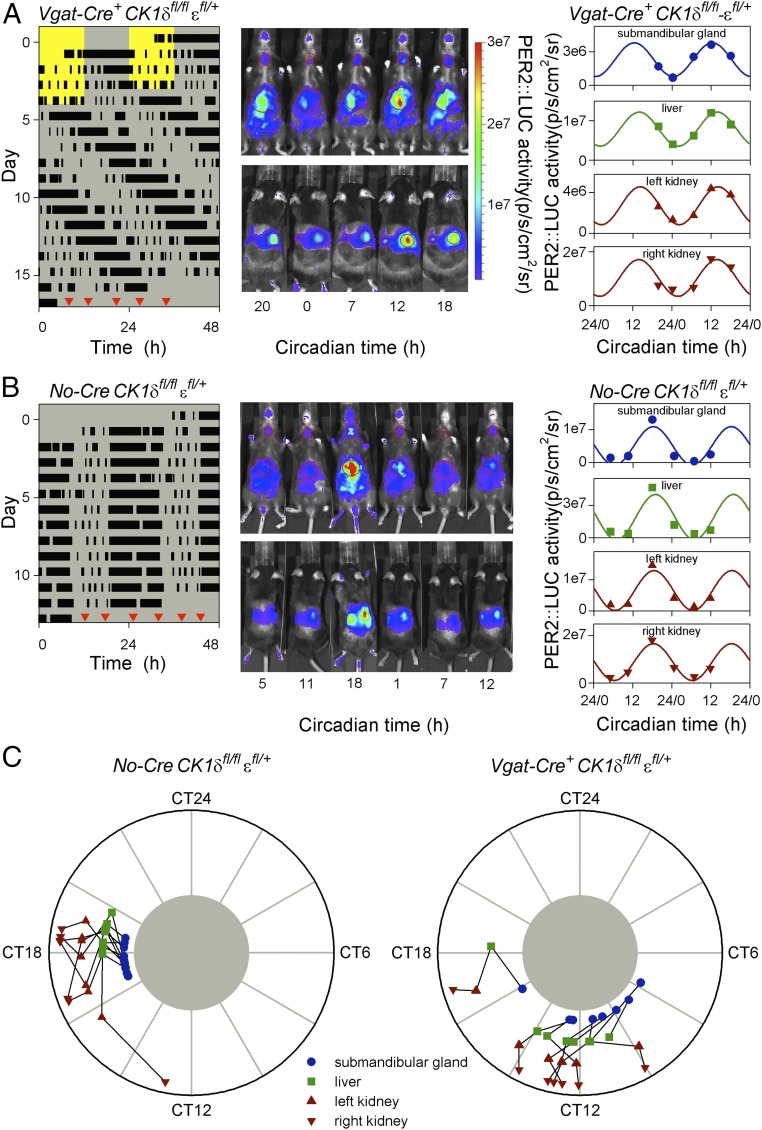
Fig. 2.
Peripheral clocks of Discordant mice entrain to the long behavioral period with a shifted peak phase. (A and B) Representative examples of in vivo PER2::LUC bioluminescence imaging of a Discordant (Vgat-Cre+ CK1δfl/fl εfl/+ Per2::Luc/+; A) and Cre-negative control (No-Cre CK1δfl/fl εfl/+ Per2::Luc/+; B) mouse. The timing of running-wheel activity was measured for 12–13 d in constant darkness (actograms shown at Left) before mice were imaged 5–6 times at ∼6-h intervals from both the ventral and dorsal side (Center). Red triangles in each actogram indicate the order and timing of bioluminescence image collection, and images are shown from left to right in the order they were collected. Circadian time was determined by extrapolation of the onset of activity from the actogram. By definition, circadian time 12 corresponds to the onset of activity and a circadian cycle lasts 24 circadian hours. In vivo PER2::LUC bioluminescence was quantified for the submandibular gland, liver and each kidney (values from each measurement from these two animals are shown at Right). Cosinor curve fits with a period of 24 circadian hours are presented for each of the four organs. (C) Peak PER2::LUC bioluminescence phase plots of Cre-negative control (Left) and Discordant mice (Right) for submandibular gland, liver, and each kidney. PER2::LUC bioluminescence in peripheral organs peaked in the middle of the active phase (circadian time 18) for Cre-negative controls but was significantly phase advanced in Discordant mice (circadian time 12). The timing of peak PER2::LUC bioluminescence is depicted separately for each of the four organs, with black lines connecting different tissues of the same animal. CT, circadian time.

