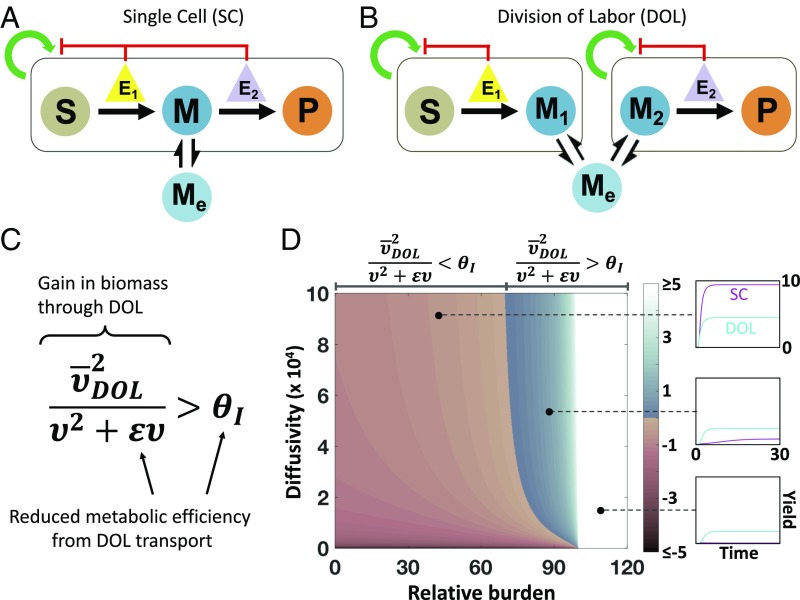
Fig. 1.
Design criterion of DOL. (A) Model framework for an intracellular pathway within a single population (SC). Substrate (S) is converted to intracellular intermediate (M), which diffuses into the extracellular environment (Me) and is directly converted to final product (P). Enzyme expression (E1 and E2) suppress the growth of the population. (B) Model framework for an intracellular pathway within two populations (DOL). S is converted to intracellular intermediate (M1), which diffuses into extracellular environment (Me) and then into population 2 (M2), where it is converted to P. Enzyme expression (E1 and E2) suppresses the growth of the population they are contained in. (C) The design criterion defines when DOL is favored over SC. The left-hand side of the inequality represents the gain in biomass by DOL; the right-hand side represents the inefficiency of DOL. (D) The criterion determines the parametric spaces where each design strategy is favored. The color of the heat map indicates the magnitude of . Expressions for each term in the inequality are detailed in the main text and SI Appendix. To the left of the border , SC produces more P than DOL (Top). To the right of the border, DOL produces more P than SC (Middle). Above a certain level of burden, DOL always outperforms SC because the SC population goes extinct (white region, Bottom). Past a maximum level of burden, both DOL populations go extinct (black region).

