Fig. 3.
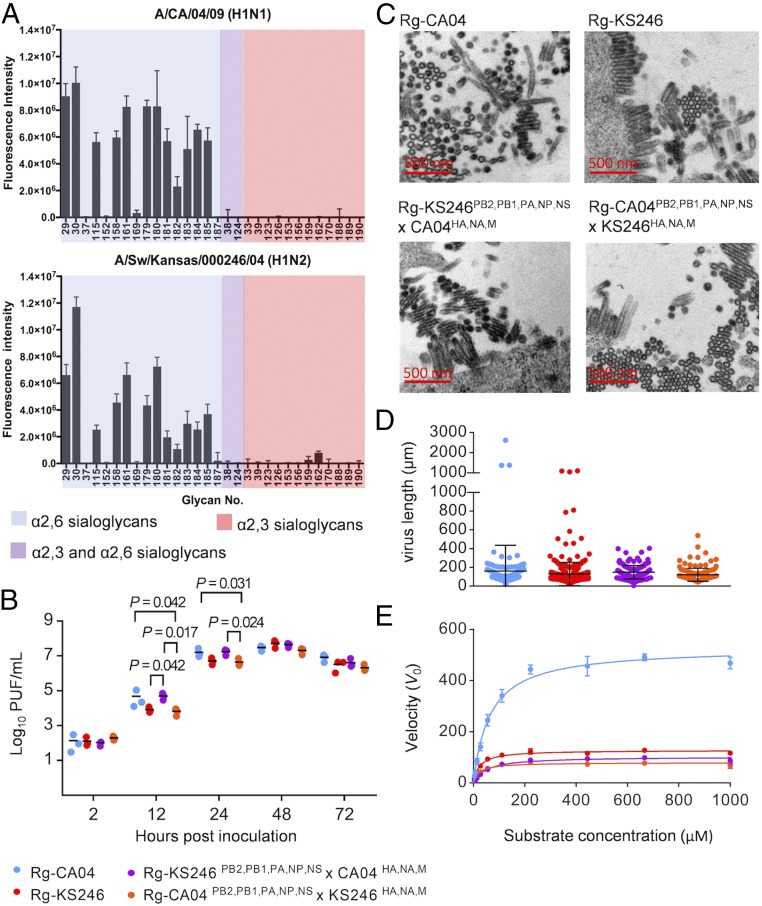
Characterization of CA04 and KS246 recombinant viruses in vitro. (A) Glycan array analysis of CA04 and KS246 viruses. CA04 and KS246 viruses were inactivated by 0.025% formaldehyde and diluted to 16 HA titers (0.5% turkey red blood cells) for analysis. The fluorescence signal was acquired by using the NimbleGen MS 200 Microarray Scanner. The experiment was repeated independently twice with six replicates at each repeat. (B) Replication kinetics of recombinant Rg-CA04, Rg-KS246, Rg-KS246PB2,PB1,PA,NP,NS×CA04HA,NA,M, and Rg-CA04PB2,PB1,PA,NP,NS×KS246HA,NA,M in differentiated HAE cells. The viral replication efficiencies in HAE cells at a multiplicity of infection (MOI) of 0.01 PFU/cell were determined (mean ± SD of three replicates shown). P values <0.05 from Dunn’s multiple comparisons after Kruskal–Wallis test are shown. (C) Representative images of virion morphology under a transmission electron microscope (8,900×) after 14 h propagation in MDCK cells at an MOI of 2 PFU/cell. (D) Comparison of virion length of recombinant viruses of different gene constellations. One hundred virions were randomly selected from images taken from transmission EM to determine the virion length (one-way ANOVA, P = 0.0761). (E) NA enzyme kinetics using the fluorogenic substrate MUNANA. The viruses were diluted to 106 PFU/mL, and the kinetic data were fit to the Michaelis–Menten equation by nonlinear regression to determine Km and Vmax of substrate conversion. The experiment was repeated independently twice, and mean ± SD is shown.

