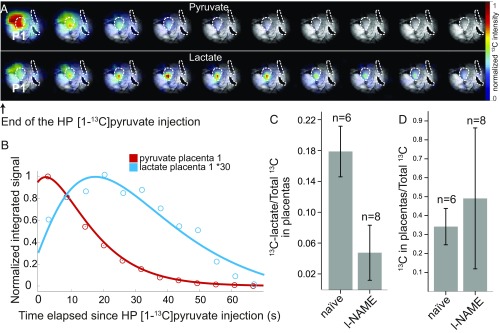
Fig. 6.
HP 13C MRSI data collected on l-NAME–treated pregnant rats. (A) Pyruvate and lactate images collected 5 s apart following the injection of HP [1-13C]pyruvate in a pregnant rat (E18), starting ca. 4 s after completion of the metabolite’s injection. The 13C MRSI sets were recorded on a 10-mm-thick slice with a 1.5 × 1.5 mm2 in-plane resolution and are shown overlaid on the corresponding anatomical 1H MRI slice (obtained from the surface coil). The three dashed curves highlight placentas from different fetuses; P1, the placenta that exhibits the highest 13C signal intensity, was used for the analysis shown in B. (B) The 13C signal intensities extracted as a function of postinjection time from the voxel highlighted in the 13C images. The lines are best fits determined as described in the text and summarized in SI Appendix, Table S2. (C) Summary of the signal intensity ratios between the [1-13C]lactate and the total 13C signals integrated from placentas for naïve and l-NAME–treated rats, with n = 6 (naïve) and n = 8 (l-NAME) separate injections. (D) Idem as in C but upon comparing the ratios between total hyperpolarized 13C signals arising from within and from (within + without) placentas, in the same animal cohort.

