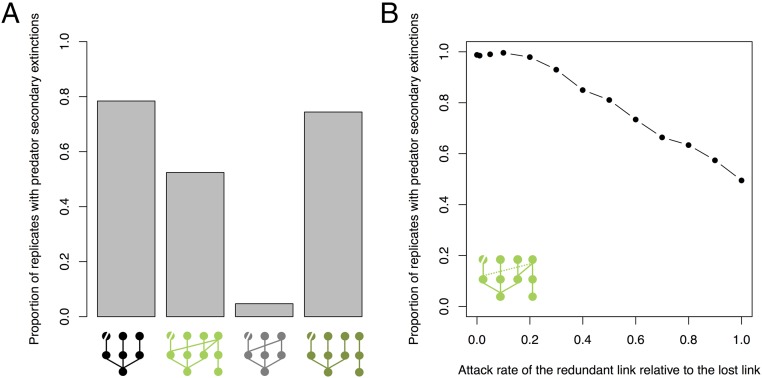
Fig. 3.
Predator secondary extinctions in the modeled food web scenarios. The proportions of replicates with predator secondary extinctions in four different food web structures (A) and as a function of the predator attack rate in the redundant link relative to other predator attack rates (B) are shown. Each food web scenario was replicated 1,000 times with varying model parameter values. The food web structure modeled in each scenario is represented below the panels, with the removed species indicated by a diagonal line through its node. The dotted line in B indicates the position of the redundant link in the food web.

