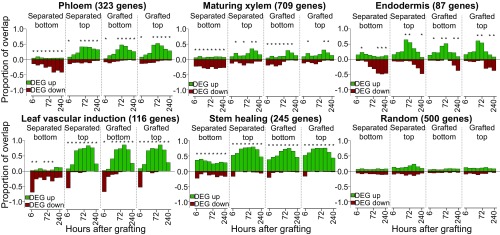
Fig. 2.
Transcriptional overlap between previously published vascular datasets and the grafting datasets. Genes, the transcripts of which are associated with various cell types or biological processes, were taken from previously published datasets (Dataset S1) and compared with the transcriptomic datasets generated here. The number in parentheses represents the number of cell-type–specific or process-specific genes identified in previous datasets. Overlap is presented as a ratio of 1.0 for differentially expressed genes (DEG) up- or down-regulated in our dataset relative to intact samples compared with up- and down-regulated genes in the previously published transcriptome dataset. An asterisk represents a significant overlap (P < 0.05) for a given time point.

