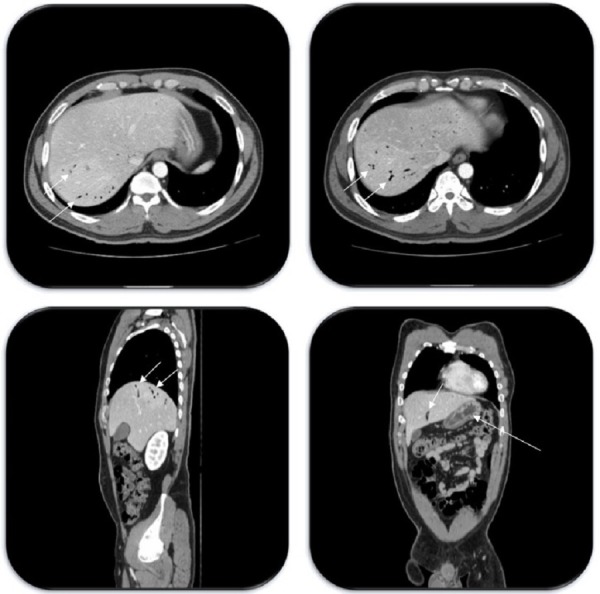
Figure 1. Axial (upper two images), sagittal (left lower image), and coronal (right lower image) abdominal CT scan images showing diffuse portal venous gas (short arrows) and gastric wall thickening (long arrow) up to 1 cm.

CT: computed tomography

CT: computed tomography