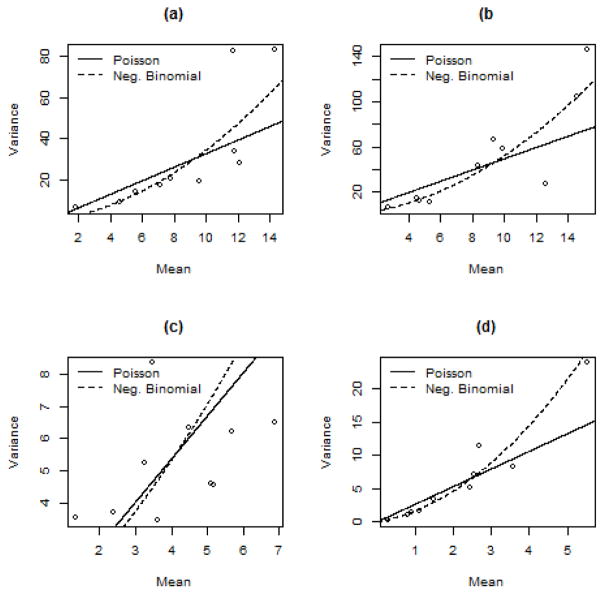
Figure 1. Count Model Dispersion Plots.
Plot (a) is model 1 of the positive word count, plot (b) is model 2 of the negative word count, plot (c) is model 3 of the pro-CWF word count, and plot (d) is model 4 of the anti-CWF word count. All plots demonstrate the best fit lines of the multilevel Poisson models compared to the negative binomial models. For all models, the Poisson model explains most of the data up until the high mean values. Higher means are better explained by negative binomial models. However, in the data the random effects largely explained by the high mean values, and the lack of degrees of freedom lead to a failure of multilevel negative binomial models to converge. Therefore, the Poisson multilevel models explaining the data sufficiently

