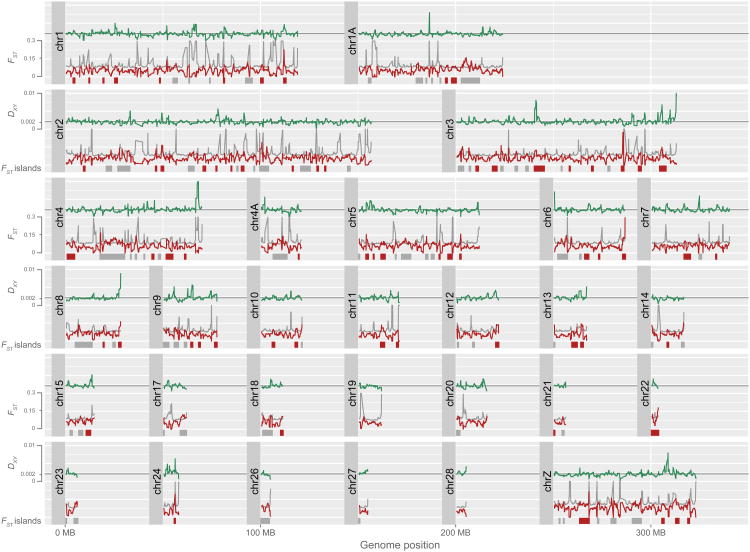
Figure 1.
FST and Dxy values along the chromosomes. FST is drawn by red line and Dxy by green line. Grey lines represent the genomic average for Dxy and bootstrap values for FST. Genomic position is based on the mapping of nightingale contigs to the zebra finch genome. Genomic islands with significantly elevated FST values are depicted as grey or red bars. Red bars indicate genomic islands of elevated FST with average Dxy higher than the genome average.

