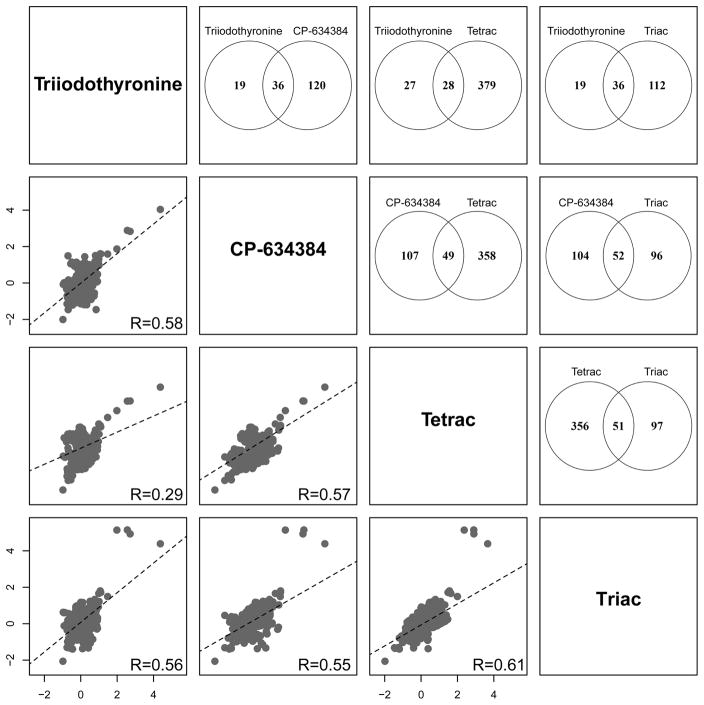
Figure 5.
Scatter matrix and significant transcript overlap between T3, Triac, Tetrac, and CP-634384. Transcriptional profiles of the thyroid chemical group using pairwise scatter matrices of the 614 unique significant differentially expressed transcripts are shown in the bottom half of the plot. Dashed lines indicate the regression line for each comparison and the Pearson correlation coefficient is provided in the bottom right of each plot. Venn diagrams representing the pairwise overlap of significant transcripts for each treatment pair are shown in the top half of the plot.

