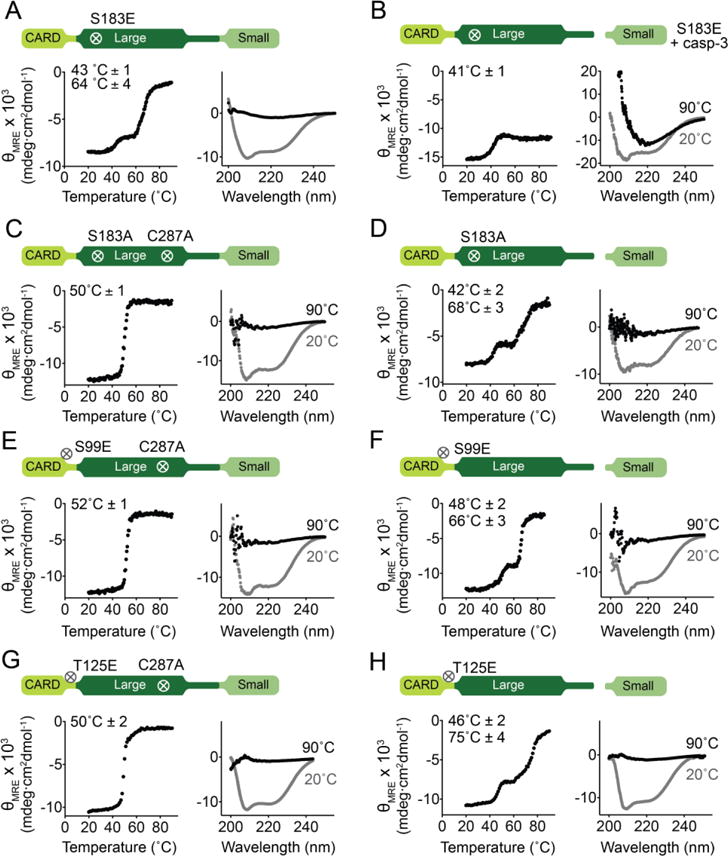
Figure 7. Phosphomimetic S183E disrupts CARD:core interactions.

Thermal denaturation curves monitored by circular dichroism with the thermal melting temperatures (Tm) for each transition listed (left) and circular dichroism spectra (right) of caspase-9 variants.
(A) Full-length, monomeric, uncleaved S183E exhibits three-state unfolding (two melting transitions), unlike other full-length, uncleaved caspase-9 variants, suggesting that S183E breaks CARD:core interactions because the two domains unfold independently.
(B) Cleavage of S183E by caspase-3 leads to destabilization and formation of aggregates.
(C) Full-length, monomeric, uncleaved S183A (catalytic-site inactivated C287A) shows a single melting transition, indicating an intact CARD:core interaction.
(D) Full-length, monomeric, cleaved S183A behaves similarly to full-length, monomeric, cleaved caspase-9 that exhibits three-state unfolding.
(E) and (G) Full-length, monomeric, uncleaved (constructed in the background of C287A) S99E (E) and T125E (G) exhibit two-state unfolding (single melting transition), suggesting intact CARD:core interactions.
(F) and (H) Full-length, monomeric, cleaved S99E and T125E behaves similarly to full-length, monomeric, cleaved caspase-9 that exhibits three-state unfolding.
Thermal denaturation curves (left) and CD spectra (right) of caspase-9 variants. Plots are representative of three trials. Tm values shown are means ± SEM of three trials done on three separated days.
