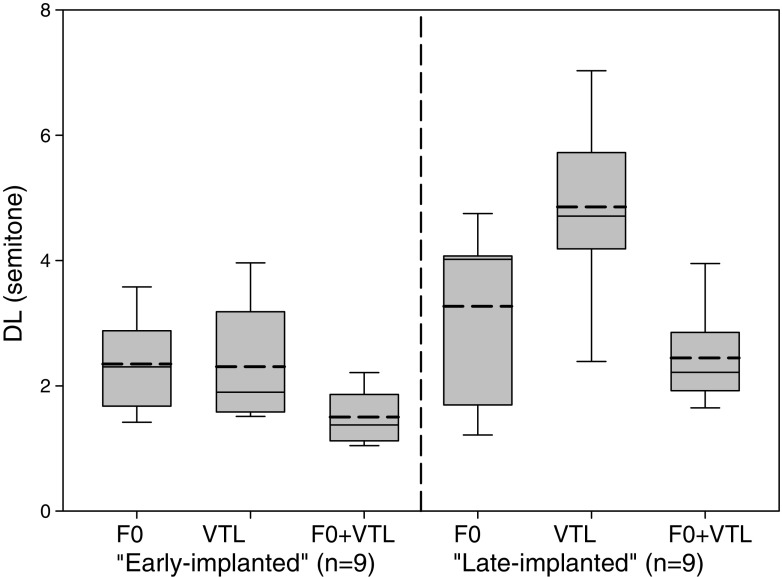
Fig. 2.
Box and whiskers plots for the mean F0, VTL, and F0 + VTL discrimination thresholds, separately for “early-implanted” individuals and “late-implanted” individuals. Box limits include the 25th–75th percentile data. The continues horizontal line within each box represents the median and the dashed horizontal line represents the mean. Bars extend to the 10th and 90th percentiles

