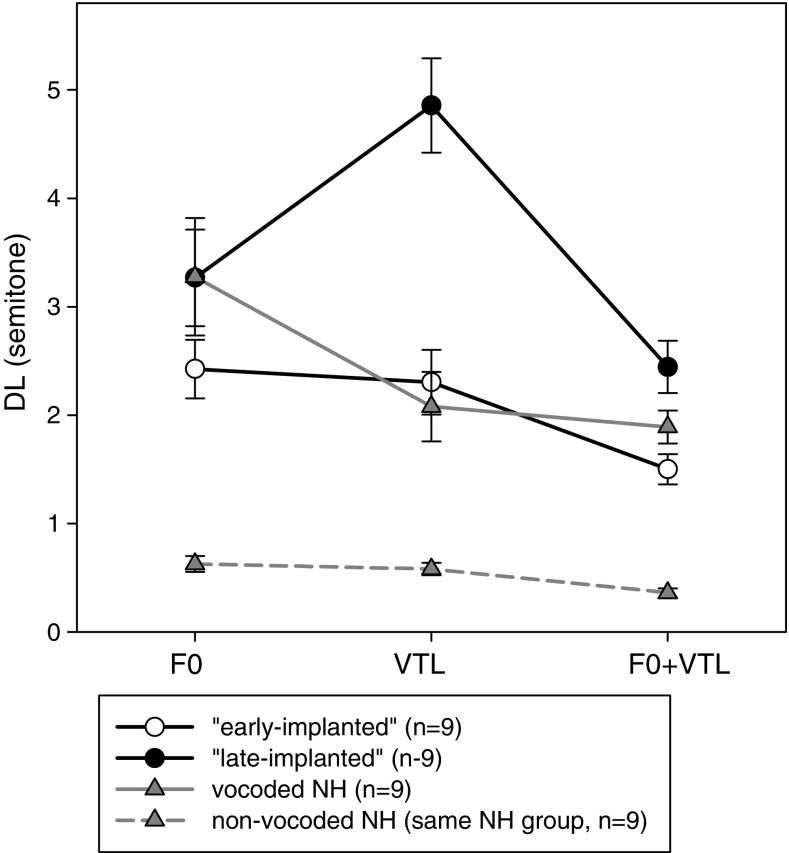
Fig. 3.
Mean (± SE) F0, VTL, and F0 + VTL DL for the early-implanted CI users (n = 9) and “late-implanted” CI users (n = 9) as compared to the NH listeners who listened to vocoded stimuli (n = 9). Also shown are the F0, VTL, and F0 + VTL DL of the (same) NH listeners who listened (in their fourth measurement) to non-vocoded stimuli (dashed line)

