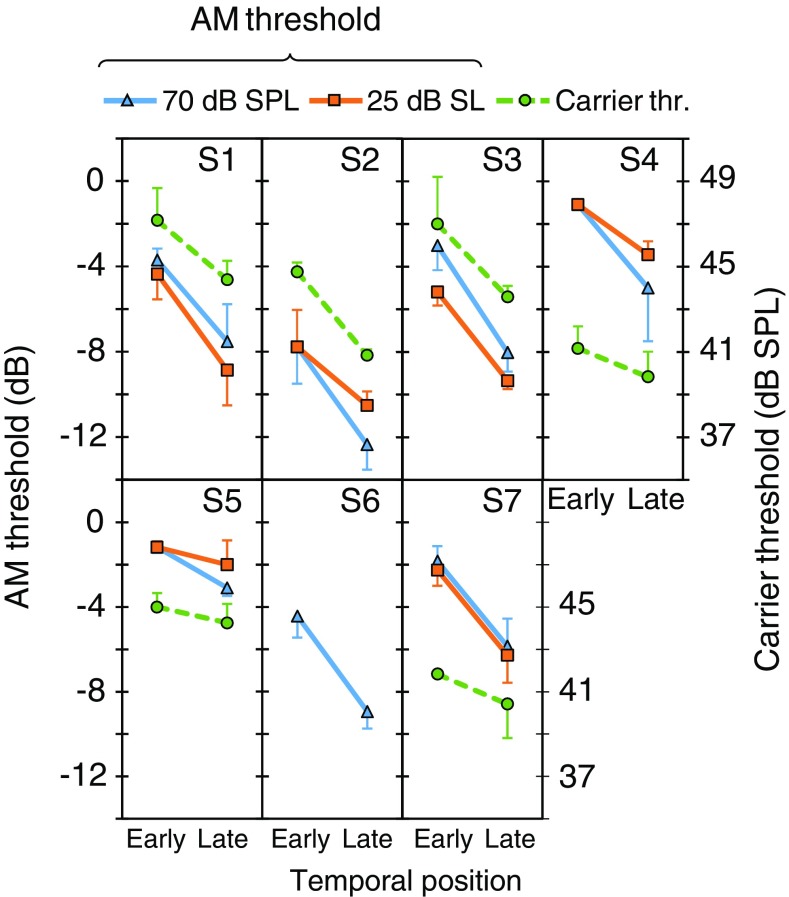
Fig. 4.
The effect of probe temporal position in bilateral BBN on carrier detection thresholds (circles, dashed traces) and AM detection thresholds (continuous traces). Each panel shows data for an individual listener. Two AM detection thresholds are shown per listener: one for 70 dB SPL (triangles) and one for 25 dB SL (squares) carriers, as indicated by the inset at the top of the figure. Each data point is the mean of three measures; error bars illustrate one standard deviation. Note that the left ordinate is for AM detection thresholds while the right ordinate is for carrier detection thresholds. See main text for details

