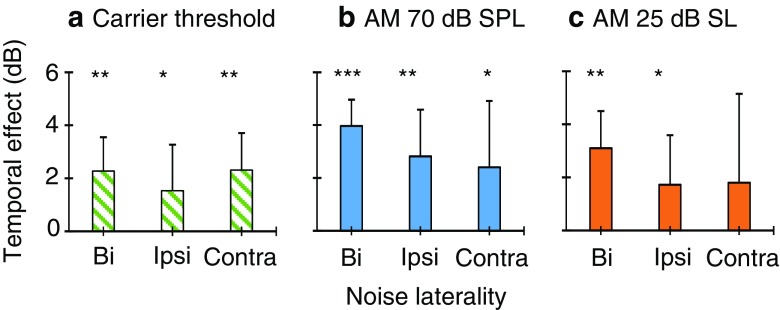
Fig. 8.
Magnitude of the temporal effect on carrier detection thresholds (a) and AM detection thresholds for 70 dB SPL (b) and 25 dB SL carriers (c). The temporal effect represents the threshold in the early condition minus the threshold in the late condition. Panel b shows the mean of seven subjects, while panels a and c show the mean of six subjects. Error bars illustrate one standard deviation of the mean. Asterisks indicate statistical significant differences at p < 0.05 (*), p < 0.01 (**) and p < 0.001 (***)

