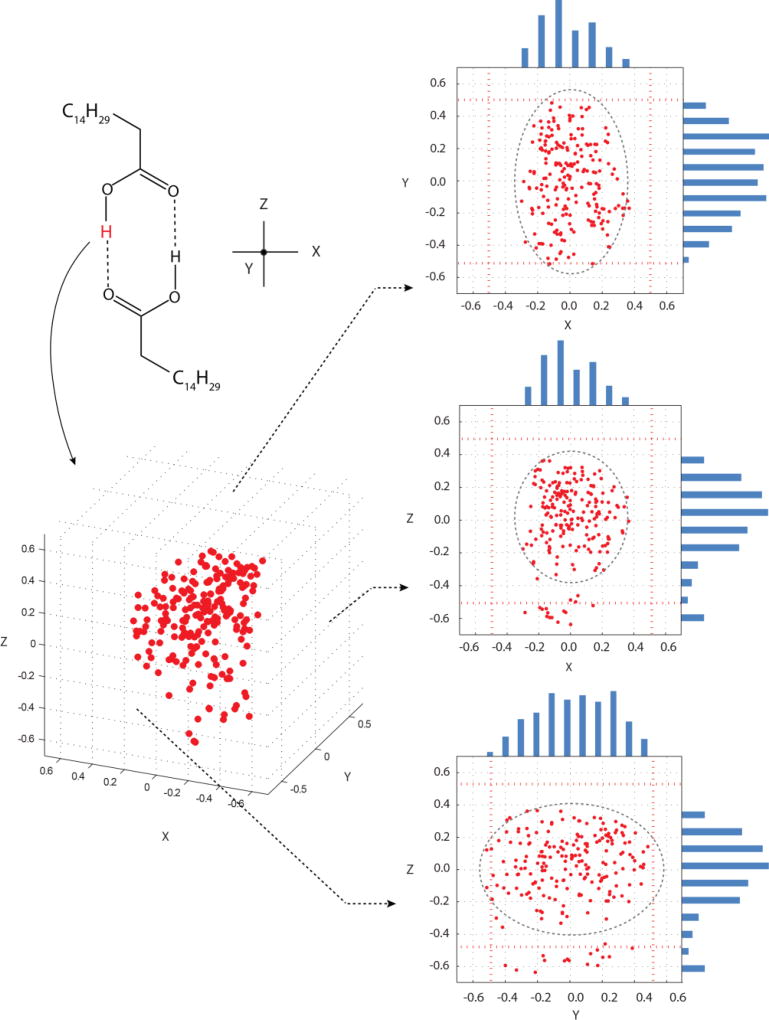
Figure 4.
A plot of COOH hydrogen positions retained for palmitic acid phase A2, based on agreement of computed 13COOH tensors for each point with experimental 13COOH values at the ±1σ level. Projections onto the XY, XZ and YZ-planes are included together with histograms along each axis. Outlier points along the Z-axis represent a small probability that the cis orientation can occur. Red dashed lines denote sampling boundaries of ±0.5 Å from the initial hydrogen position. Estimates of uncertainties in atom positions are shown by ellipsoids drawn at the ±2σ level. These ellipsoids illustrate that slight truncation of the Y-dimension has only a minor influence on the predicted positional uncertainties. Nearly identical plots were obtained for phases Bm and Em, thus these plots are not shown.

