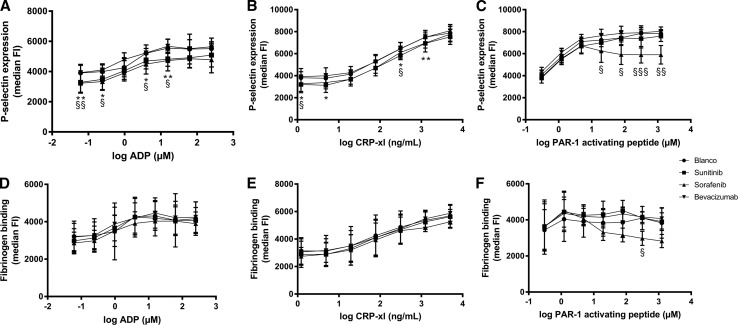
Fig. 2.
In vitro expression of P-selectin and binding of fibrinogen on platelets after platelet activation by ADP, CRP-xL or PAR-1 activating peptide in the presence of sunitinib, sorafenib and bevacizumab. a Expression of P-selectin after activation of platelets with ADP. b Expression of P-selectin after activation of platelets with CRP-xL. c Expression of P-selectin after activation of platelets with PAR-1 AP. d Fibrinogen binding after activation of platelets with ADP. e Fibrinogen binding after activation of platelets with CRP-xL. f Fibrinogen binding after activation of platelets with PAR-1 AP. On the X-axis are the log scales of the concentrations of the agonists used (ADP: µM, CRP-xL: ng/ml, PAR-1 AP: µM). On the Y-axis the median fluorescence intensity is expressed. N = 4. The error bars represent the standard deviation. Sunitinib: * = p ≤ 0.05, ** = p ≤ 0.01. Sorafenib: § = p ≤ 0.05, §§ = p ≤ 0.01, §§§ = p ≤ 0.001

