
Fig. 4.
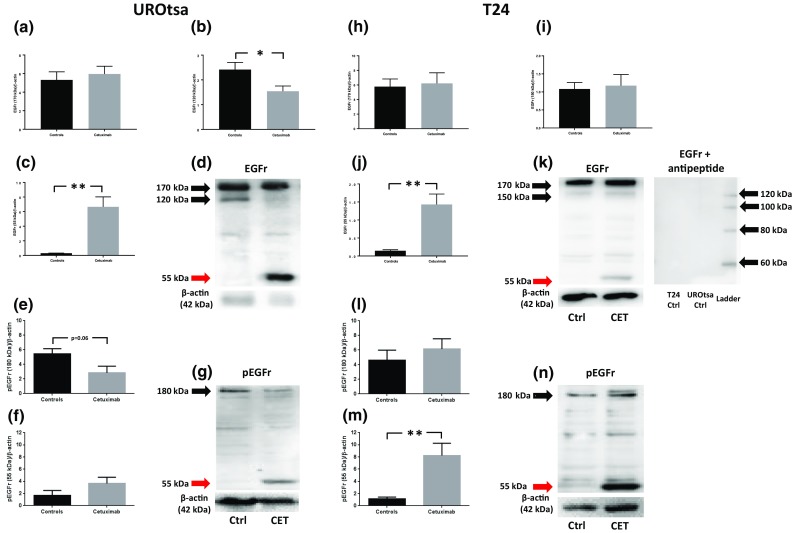
Western blot analyses of EGFr expressions in UROtsa (a–c) and in T24 (h–j); representative graphs in d, k, respectively, and pEGFr in UROtsa (e, f) and in T24 (l–m); representative graphs in g, n, respectively. Black arrows indicate EGFr and pEGFr, respectively, while red arrows indicate fragments of protein at 55 kDa. Membrane incubated with anti-EGFr in the presence of EGFr peptide is displayed in 4 k. *p < 0.05 and **p < 0.01. Vertical bars represent the SEM