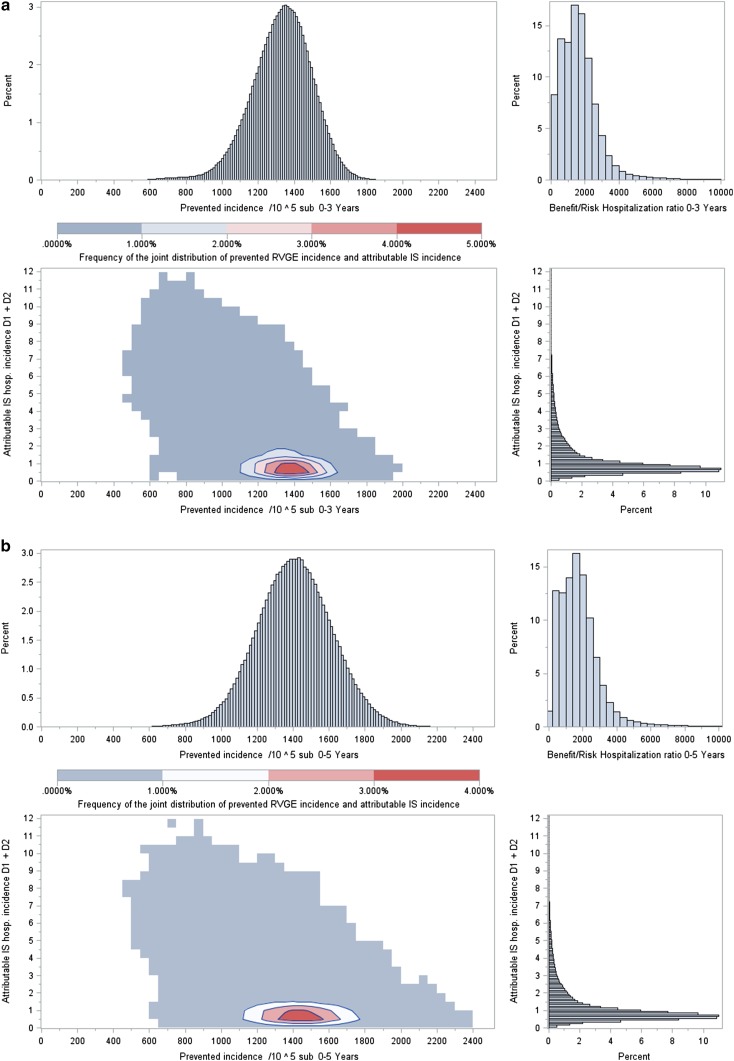
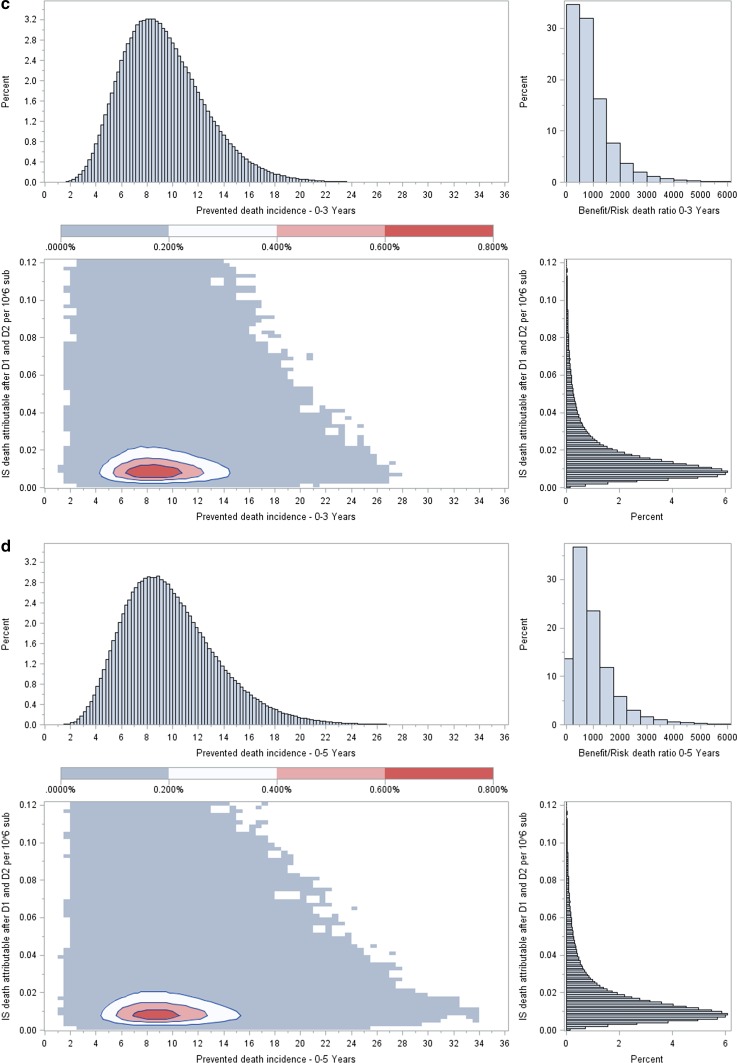
Fig. 2.
Two-dimensional plots of the overall reduction in the number of RVGE hospitalizations (a, b) and deaths (c, d) over 3 (a, c) and 5 years (b, d) risk windows (x axis) and the increase in numbers of IS hospitalizations (a, b) and deaths (c, d) post vaccination over two 7-day risk windows (y axis) for cohorts of 105 (hospitalization) and 106 (death) vaccinated French children. Each point represents the joint calculations of benefits and risks under a specific scenario selected at random from each of the random distributions of the input parameters. The results presenting the highest frequencies across the 106 simulations are colored in red. The plots illustrate the dominance of the hospitalization and death benefits in comparison to the hospitalization and death risks under all scenarios. D1 dose 1, D2 dose 2, hosp. hospitalization, IS intussusception, RVGE rotavirus gastroenteritis, sub. subjects


