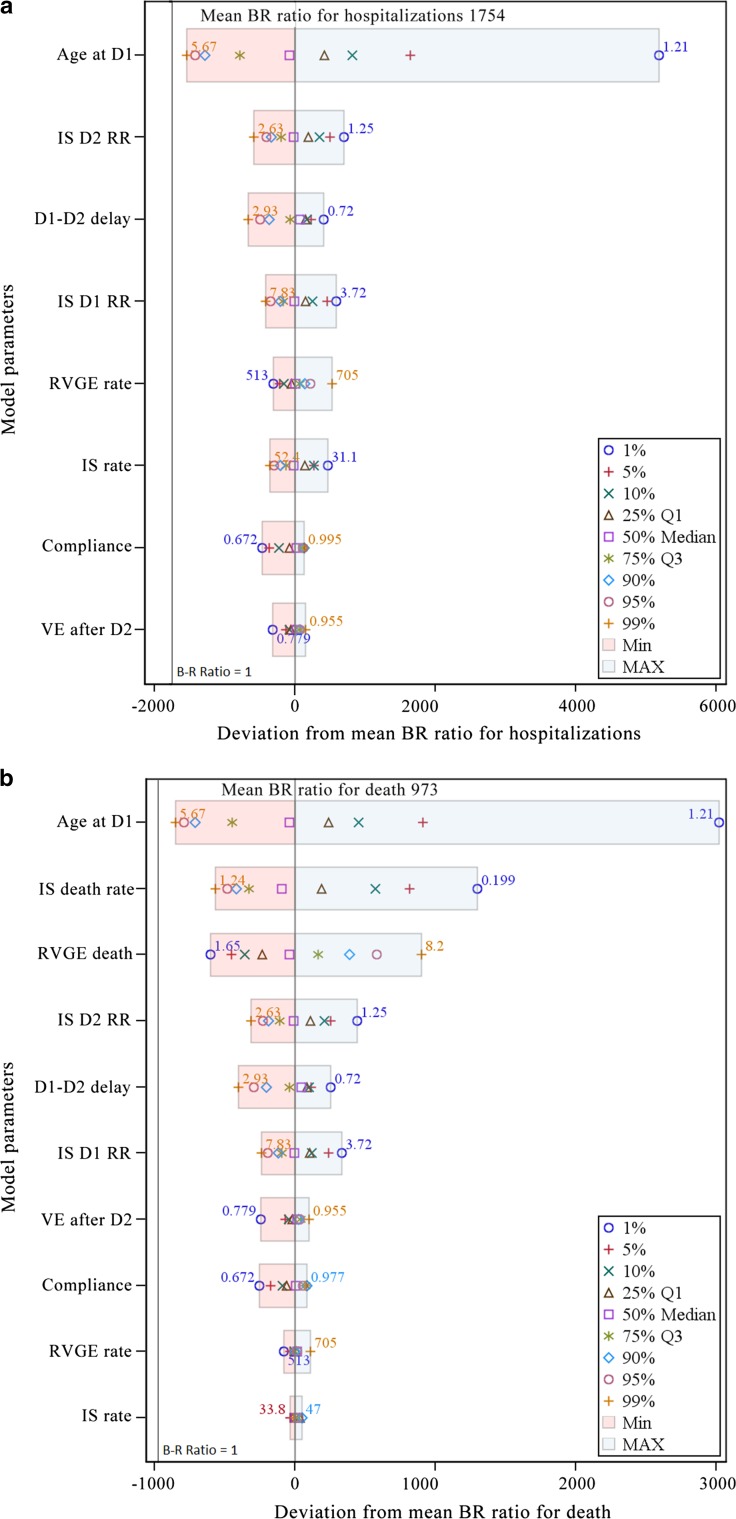
Fig. 3.
Sensitivity analysis assessing the impact of the variability of model parameters on the BR ratio for hospitalization (a) and death (b) in children 0–3 years of age. The tornado diagrams show on the x axis the variations of the BR ratio around its mean value because of variations of the main input parameters. The vertical line on the left part of the diagrams represents a BR ratio equal to 1. The left and right limits of each horizontal bar indicate the change in BR ratio calculated for the 1 and 99% percentile values of the input parameter mentioned. Other symbols indicate the BR variations expected for those percentiles of the input parameter. BR benefit–risk, D1 dose 1, D2 dose 2, IS intussusception, Max Maximum, Min Minimum, Q1 first quartile, Q3 third quartile, RR relative risk, RVGE rotavirus gastroenteritis, VE vaccine efficacy

