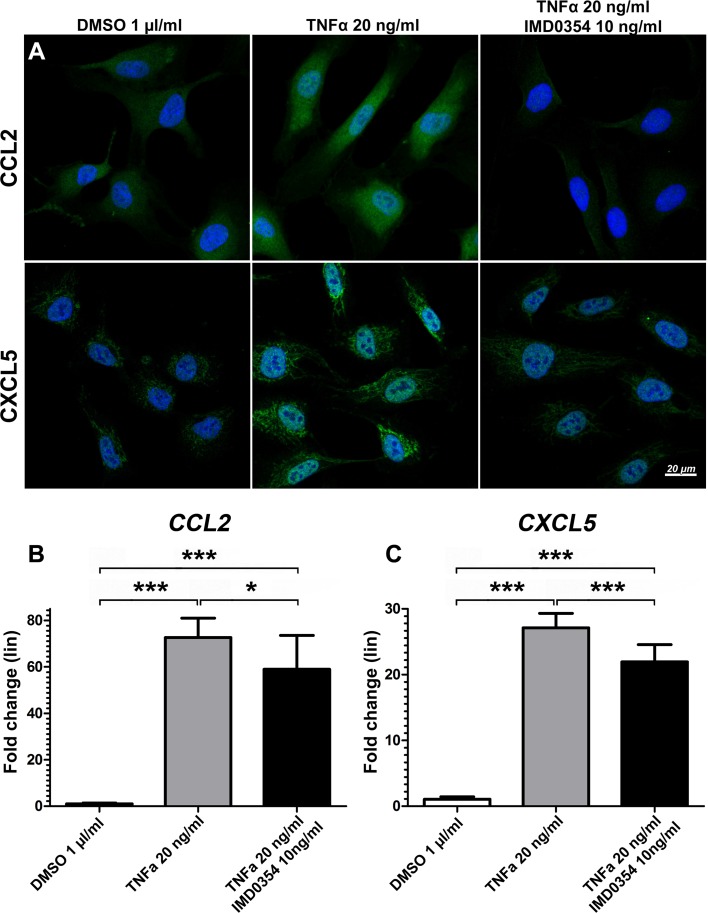
Fig. 4.
Effects of IKK2 inhibition on CCL2 and CXCL5 expression in HUVEC under TNFα stimulation. a Immunofluorescence images of CCL2 (green) and CXCL5 (green) treated with IMD0354 and stimulated by recombinant human TNF-α (rhTNFα). DMSO and rhTNF-α treatment were used as a negative and positive control, respectively. Cell nuclei visualized with DAPI staining (blue). Quantitative qRT-PCR analysis of b CCL2 and c CXCL5 expression in IMD0354 treated and rhTNF-α stimulated HUVEC (n = 4). One-way ANOVA test with Tukey multiple comparisons was used to determine statistical significance. *p < 0.05; ***p < 0.001

