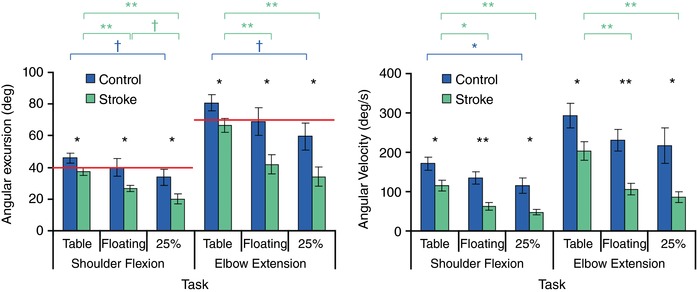
Figure 2. Kinematic data for straight line ballistic reaches.

Left, group‐average maximum joint angular excursions for control (blue) and stroke (green) participants. Red line: angular excursion required to reach target. Right, group‐average maximum angular velocities for shoulder flexion and elbow extension for control and stroke participants. Statistical significance is indicated above each graph and is colour coded to indicate between‐group (black) or between‐task (blue or violet) one‐way ANOVAs († P < 0.1, * P < 0.05, ** P < 0.01). [Color figure can be viewed at http://wileyonlinelibrary.com]
