
Figure 4. A proximity ligation assay (PLA) reveals four types of HICC complexes in HepG2 cells.
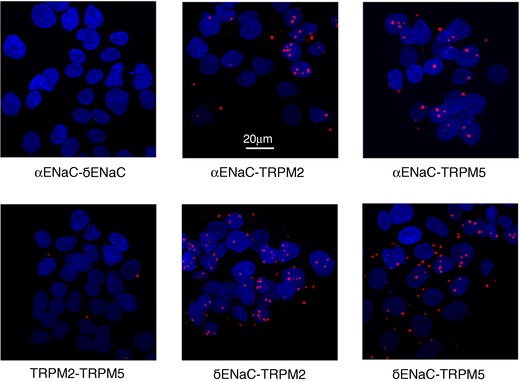
PLA signals shown as red dots were obtained for the various combinations of HICC elements as indicated. The blue areas are cell nuclei stained with DAPI. Data shown are representative of a total of 5 each. Note the close correlation of αENaC or δENaC with either TRPM2 or TRPM5 represented by the red dots of the PLA signal. In contrast, no proximity was detected for αENaC/δENaC and TRPM2/TRPM5.