
Figure 6. Effects of HICC silencing on HepG2 cell growth and apoptosis.
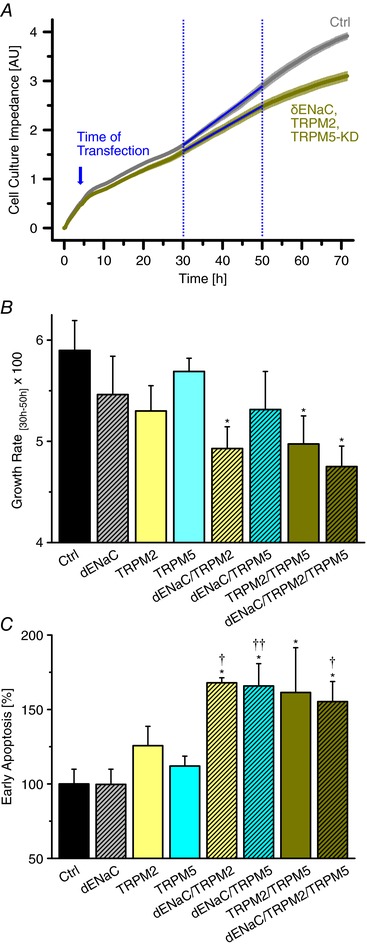
A, typical recordings of cell culture impedance under control conditions and for the triple KD. For quantification of cell proliferation, the quasi linear range of 30–50 h was employed. B, channel silencing inhibits HepG2 cell proliferation as determined with the impedance recordings. * refers to the control siRNA (n = 6). C, effects of HICC silencing on HepG2 early apoptosis determined by FACS (n = 4–6). * and ** refer to the control siRNA, † and †† to δENaC.